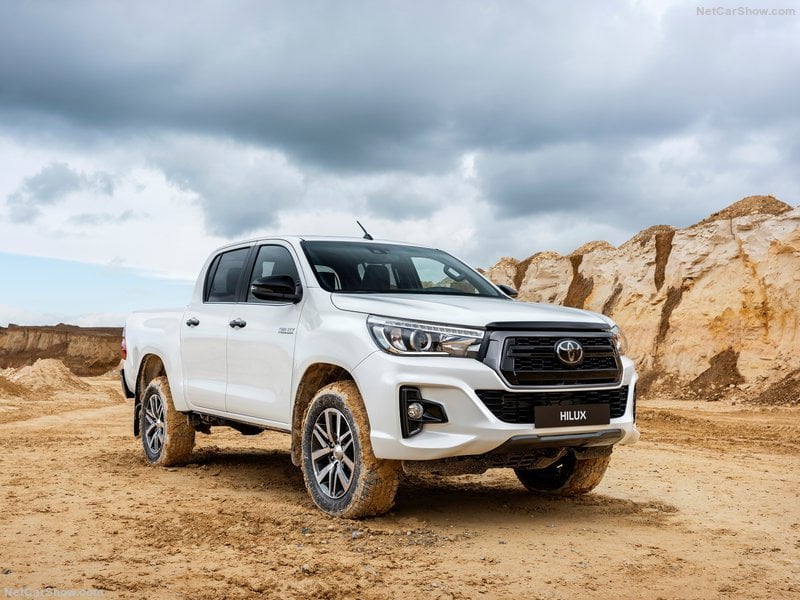
Africa best selling cars in 2019 have seen the Toyota Hilux back on top of the ranking with 4.9% of share, just a few units ahead of the former leader, the Volkswagen Polo. Isuzu D-Max and Toyota Hiace signed stunning performances, landing respectively in 6th and 11th place.
Economic Environment
Africa’s economic growth has stabilized at 3.4 percent in 2019 and is expected to pick up to 3.9 percent in 2020 and 4.1 percent in 2021 but to remain below historical highs. Growth’s fundamentals are also improving, with a gradual shift from private consumption toward investment and exports. For the first time in a decade, investment accounted for more than half the continent’s growth, with private consumption accounting for less than one third.
Market Trend
After temporarily losing the leadership, the Toyota Hilux wen back on top in 2019, holding 4.9% of the market. The First generation Hilux was born in 1968 and in this 50 years was followed by regular updates. The Hilux has gained a reputation for exceptional sturdiness and reliability during sustained heavy use or even abuse.
A few units behind, we find the best passenger car and the 2018 leader, the Volkswagen Polo holding 4.9% while declining 8.1%, followed by the Renault Symbol and the Ford Ranger, respectively at 4.3% and 2.6%.
In fifth place the Chevrolet TFR with 1.8% of market share, ahead of the fast-growing (+127.5%) Isuzu D-Max, landing in 6th position.
Behind, all models registered negative performances. Indeed, in seventh place, the Nissan NP200 – down in double-digits – with 1.5%, followed – just a few units behind – by the Hyundai Tucson, the Toyota Corolla (-39%) and the Toyota Fortuner.
| Rank 2019 | Rank 2018 | Model | Sales 2019 | 2019 Var |
|---|---|---|---|---|
| 1 | 2 | Toyota Hilux | 57051 | -1,1% |
| 2 | 1 | Volkswagen Polo | 56653 | -8,1% |
| 3 | 3 | Renault Symbol | 49295 | 2,9% |
| 4 | 4 | Ford Ranger | 30573 | -16,9% |
| 5 | 7 | Chevrolet TFR | 20397 | 4,7% |
| 6 | 31 | Isuzu D-Max | 20333 | 127,5% |
| 7 | 6 | Nissan NP200 | 17916 | -10,9% |
| 8 | 8 | Hyundai Tucson | 17720 | -3,6% |
| 9 | 5 | Toyota Corolla | 15958 | -39,0% |
| 10 | 11 | Toyota Fortuner | 14362 | -10,4% |
| 11 | 71 | Toyota Hiace | 13917 | 217,1% |
| 12 | 13 | Hyundai Elantra | 13869 | -9,6% |
| 13 | 16 | Nissan Sunny | 13374 | -2,8% |
| 14 | 27 | Renault Kwid | 12621 | 21,3% |
| 15 | 18 | Volkswagen Tiguan | 12186 | -5,5% |
| 16 | 19 | Dacia Dokker | 12119 | -2,5% |
| 17 | 9 | Seat Ibiza | 12009 | -34,0% |
| 18 | 26 | Kia Sportage | 11396 | 5,8% |
| 19 | 14 | Hyundai Grand i10 | 11155 | -24,8% |
| 20 | 15 | Nissan Qashqai | 11019 | -22,4% |
| 21 | 46 | Ford Ecosport | 10748 | 59,2% |
| 22 | 17 | Kia Picanto | 10538 | -22,1% |
| 23 | 29 | Renault Sandero | 10397 | 6,9% |
| 24 | 22 | Volkswagen Golf | 10088 | -10,4% |
| 25 | 25 | Toyota Etios | 9813 | -9,5% |
| 26 | 14 | Dacia Duster | 9374 | -36,8% |
| 27 | 35 | Volkswagen Caddy | 9178 | 13,7% |
| 28 | 10 | Toyota Quantum | 9131 | -45,9% |
| 29 | 28 | Hyundai Verna | 8929 | -8,5% |
| 30 | 24 | Renault Clio | 8866 | -20,6% |
| 31 | 20 | Dacia Logan 1,5 Dci | 8828 | -24,8% |
| 32 | 34 | Toyota RAV4 | 8773 | 5,8% |
| 33 | 54 | Dacia Sandero | 8749 | 47,3% |
| 34 | 324 | Toyota Corolla Quest | 8513 | 2655,0% |
| 35 | 32 | Renault Duster | 8482 | -1,4% |
| 36 | 97 | Seat Leon | 8199 | 179,2% |
| 37 | 47 | Ford Figo | 8066 | 21,5% |
| 38 | 23 | Renault Clio 1.5 TDCi | 8059 | -28,0% |
| 39 | 30 | Nissan NP300 Hardbody | 7944 | -17,8% |
| 40 | 21 | Toyota Yaris | 7628 | -33,1% |
| 41 | 56 | Suzuki Swift | 7470 | 32,2% |
| 42 | 51 | Hyundai i20 | 7299 | 17,2% |
| 43 | 33 | Chevrolet NHR | 7242 | -12,9% |
| 44 | 38 | Renault Kadjar | 6697 | -11,8% |
| 45 | 42 | BYD F3 | 6562 | -4,9% |
| 46 | 45 | Mitsubishi L200 | 6512 | -4,6% |
| 47 | 55 | Datsun Go | 6377 | 7,5% |
| 48 | 37 | Dacia Sandero 1,5 Dci | 6231 | -19,7% |
| 49 | 43 | Mercedes C Class | 6120 | -10,7% |
| 50 | 52 | Toyota Avanza | 5729 | -7,2% |


