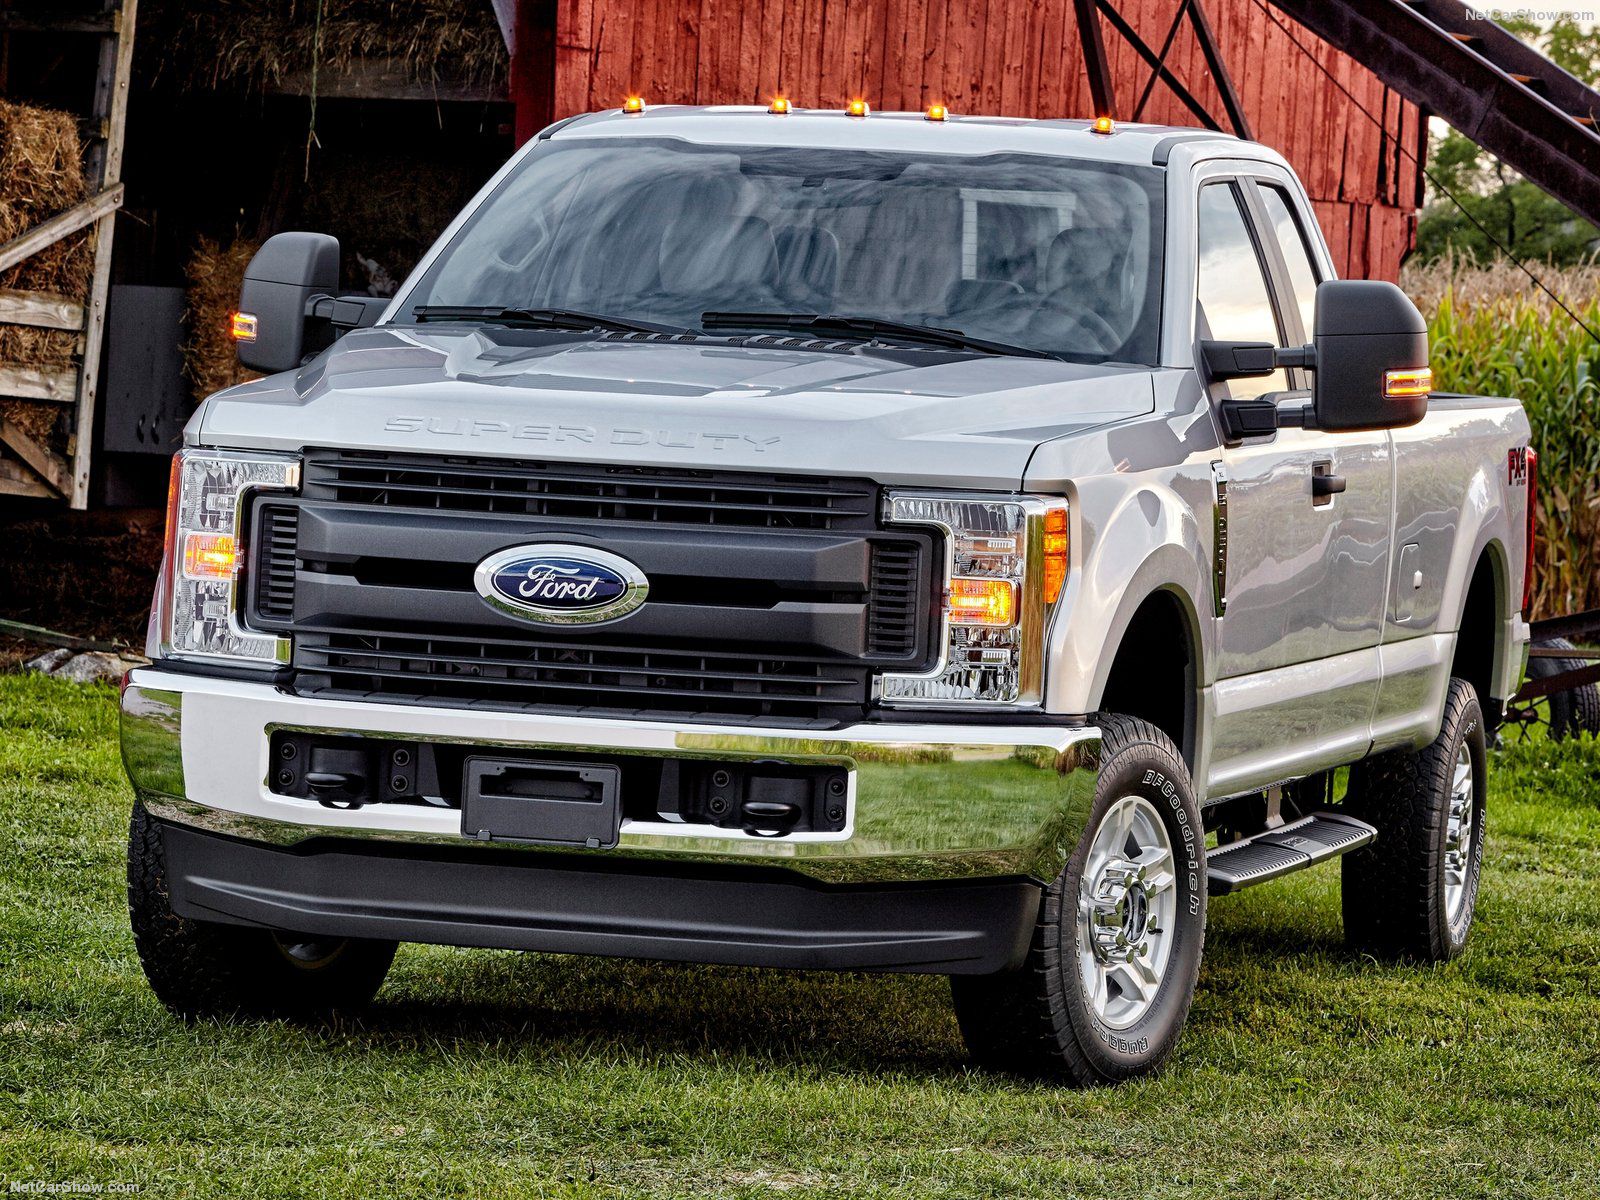
USA Best Selling Vehicle in the 2017 dominated for the 42nd year by the amazing Ford F-Series. Hitting the American record for a single model in a single year, the popular pick up jumped over 1 million global sales, fourth model in the history.
US Vehicles market has promptly reacted at the 2008-2009 financial crisis reporting an impressive increase across the last sixth years ended with the all time record volume hit in the 2016 at 17.5 million units. Finally in the 2017 the market has braked the growth, after seven years, losing marginally (-1.8%) with 17.23 million sales. Outlook for the 2018 is moderately positive, with sales foreseen up 3.1%, potentially at the new record.
Looking at the ranking of the best-selling models, it is clear that the year will be memorable for Ford and for its more prestigious model, the F-Series, market leader here since the 1975 and able in the 2017 to be the fourth model in the history to deliver over 1 million units is a single year, becoming the second best model sold in the World.
In US during the 2017, the Ford F-Series has improved volume hitting the highest level ever sold by a single model in a single year, with 896.000 sales (+9.3%).
The second place, the Chevrolet Silverado with 585.864 units (+1.9%) followed by the Ram Pick up, third with 500.723 (+2.7%).
In fourth place the Toyota RAV4, up 4 spots, with 407.594 units (+15.7%) followed by the fast growing Nissan Rogue, up 5 spots, at 403.465 sales (+22.3%), the Toyota Camry, down 2 spots, with 387.081 sales (-0.4%) and the Honda CR-V with 377.895 units (+5.8%).
Behind the Honda Civic with 377.284 sales (+2.8%), the Toyota Corolla with 329.196 units (-13.0%) and in 10th place the Honda Accord, down 1 spot, with 322.655 (-6.5%).
Wishing to see the Full Year 2016 ranking, look here
Research, Consulting, Data & Forecast
F2M covers intensively this market with several products developed to help any investigation required. Market Researches in PDF are immediately available for download with study on the market since 2005 and with forecast up to the 2022. AutoData in EXCEL are immediately downloadable with annual sales volume, split by month, for all brands and all models distributed in the market. This year data are released year to date, but you will receive a monthly update until the year-end. See details within USA Corner Store!
Below, you can sort our interactive tables to see data regarding Brands, Groups and Models. Please bear in mind that sales data are subject to adjustments as sources will update their information. This report is updated at the publishing date and will not be modified while the next on this subject will always have the year to date data updated.
| Rank 2017 | Rank 2016 | Model | Sales 2017 | Sales 2016 | Variation 2017 |
|---|---|---|---|---|---|
| 1 | 1 | Ford F-Series | 896.764 | 820.799 | 9,3% |
| 2 | 2 | Chevrolet Silverado | 585.864 | 574.876 | 1,9% |
| 3 | 3 | Ram pick-up | 500.723 | 487.558 | 2,7% |
| 4 | 8 | Toyota RAV4 | 407.594 | 352.154 | 15,7% |
| 5 | 10 | Nissan Rogue | 403.465 | 329.904 | 22,3% |
| 6 | 4 | Toyota Camry | 387.081 | 388.618 | -0,4% |
| 7 | 7 | Honda CR-V | 377.895 | 357.335 | 5,8% |
| 8 | 6 | Honda Civic | 377.286 | 366.927 | 2,8% |
| 9 | 5 | Toyota Corolla | 329.196 | 378.210 | -13,0% |
| 10 | 9 | Honda Accord | 322.655 | 345.225 | -6,5% |
| 11 | 12 | Ford Escape | 308.296 | 307.069 | 0,4% |
| 12 | 15 | Chevrolet Equinox | 290.458 | 242.195 | 19,9% |
| 13 | 14 | Ford Explorer | 271.131 | 248.507 | 9,1% |
| 14 | 11 | Nissan Altima | 254.996 | 307.380 | -17,0% |
| 15 | 19 | Jeep Grand Cherokee | 240.696 | 212.273 | 13,4% |
| 16 | 18 | Nissan Sentra | 218.451 | 214.709 | 1,7% |
| 17 | 17 | GMC Sierra | 217.943 | 221.680 | -1,7% |
| 18 | 25 | Toyota Highlander | 215.775 | 191.379 | 12,7% |
| 19 | 13 | Ford Fusion | 209.623 | 249.902 | -16,1% |
| 20 | 20 | Hyundai Elantra | 198.210 | 208.319 | -4,9% |
| 21 | 24 | Toyota Tacoma | 198.124 | 191.631 | 3,4% |
| 22 | 23 | Jeep Wrangler | 190.522 | 191.774 | -0,7% |
| 23 | 27 | Subaru Outback | 188.886 | 182.898 | 3,3% |
| 24 | 16 | Chevrolet Malibu | 185.857 | 227.881 | -18,4% |
| 25 | 26 | Chevrolet Cruze | 184.751 | 188.876 | -2,2% |
| 26 | 28 | Subaru Forester | 177.563 | 178.593 | -0,6% |
| 27 | 21 | Jeep Cherokee | 169.882 | 199.736 | -14,9% |
| 28 | 29 | Ford Focus | 158.385 | 167.888 | -5,7% |
| 29 | 32 | Ford Edge | 142.603 | 134.588 | 6,0% |
| 30 | 34 | Hyundai Santa fe | 133.171 | 131.257 | 1,5% |
| 31 | 22 | Hyundai Sonata | 131.803 | 196.321 | -32,9% |
| 32 | 46 | Toyota 4Runner | 128.296 | 111.970 | 14,6% |
| 33 | 45 | Mazda CX-5 | 127.563 | 112.235 | 13,7% |
| 34 | 31 | Ford Transit | 127.360 | 143.244 | -11,1% |
| 35 | 41 | Honda Pilot | 127.279 | 120.772 | 5,4% |
| 36 | 36 | Dodge Grand Caravan | 125.196 | 127.678 | -1,9% |
| 37 | 42 | Chevrolet Traverse | 123.506 | 116.701 | 5,8% |
| 38 | 81 | Chrysler Pacifica | 118.274 | 62.366 | 89,6% |
| 39 | 53 | Kia Forte | 117.596 | 103.292 | 13,8% |
| 40 | 61 | Subaru Impreza | 117.401 | 88.517 | 32,6% |
| 41 | 43 | Toyota Tundra | 116.285 | 115.489 | 0,7% |
| 42 | 39 | Volkswagen Jetta | 115.807 | 121.107 | -4,4% |
| 43 | 30 | Kia Soul | 115.712 | 144.040 | -19,7% |
| 44 | 60 | Hyundai Tucson | 114.735 | 89.713 | 27,9% |
| 45 | 48 | Chevrolet Colorado | 112.996 | 108.725 | 3,9% |
| 46 | 35 | Toyota Sienna | 111.489 | 127.791 | -12,8% |
| 47 | 62 | GMC Acadia | 111.276 | 88.466 | 25,8% |
| 48 | 56 | Subaru XV Crosstrek | 110.138 | 95.677 | 15,1% |
| 49 | 47 | Lexus RX | 108.307 | 109.435 | -1,0% |
| 50 | 37 | Kia Optima | 107.493 | 124.203 | -13,5% |
| 51 | 33 | Nissan Versa | 106.772 | 132.214 | -19,2% |
| 52 | 50 | Jeep Renegade | 103.434 | 106.606 | -3,0% |
| 53 | 40 | Honda Odyssey | 100.307 | 120.846 | -17,0% |
| 54 | 44 | Kia Sorento | 99.684 | 114.733 | -13,1% |
| 55 | 52 | Chevrolet Tahoe | 98.961 | 103.306 | -4,2% |
| 56 | 66 | Honda HR-V | 94.034 | 82.041 | 14,6% |
| 57 | 49 | Dodge Journey | 89.470 | 106.759 | -16,2% |
| 58 | 58 | Dodge Charger | 88.351 | 95.437 | -7,4% |
| 59 | 71 | Buick Encore | 88.035 | 78.565 | 12,1% |
| 60 | 63 | GMC Terrain | 85.441 | 87.925 | -2,8% |
| 61 | 59 | Jeep Compass | 83.253 | 94.061 | -11,5% |
| 62 | 51 | Ford Mustang | 81.866 | 105.932 | -22,7% |
| 63 | 67 | Nissan Pathfinder | 81.065 | 81.701 | -0,8% |
| 64 | 70 | Chevrolet Trax | 79.289 | 79.016 | 0,3% |
| 65 | 72 | Mercedes C Class | 77.446 | 76.996 | 0,6% |
| 66 | 64 | Nissan Murano | 76.732 | 86.953 | -11,8% |
| 67 | 55 | Chevrolet Impala | 75.877 | 97.006 | -21,8% |
| 68 | 57 | Mazda3 | 75.018 | 95.567 | -21,5% |
| 69 | 65 | Nissan Frontier | 74.360 | 86.926 | -14,5% |
| 70 | 68 | Kia Sportage | 72.824 | 81.066 | -10,2% |
| 71 | 86 | Volkswagen Golf | 68.978 | 57.750 | 19,4% |
| 72 | 76 | Dodge Durango | 68.761 | 68.474 | 0,4% |
| 73 | 114 | Cadillac XT5 | 68.312 | 39.485 | 73,0% |
| 74 | 74 | Chevrolet Camaro | 67.940 | 72.705 | -6,6% |
| 75 | 80 | Nissan Maxima | 67.627 | 62.670 | 7,9% |
| 76 | 54 | Toyota Prius | 67.170 | 98.866 | -32,1% |
| 77 | 77 | Chevrolet Express | 65.136 | 68.007 | -4,2% |
| 78 | 79 | Dodge Challenger | 64.537 | 64.433 | 0,2% |
| 79 | 73 | Volkswagen Passat | 60.722 | 73.002 | -16,8% |
| 80 | 75 | BMW 3 Series | 59.449 | 69.588 | -14,6% |
| 81 | 91 | Lexus NX | 59.341 | 54.884 | 8,1% |
| 82 | 69 | Hyundai Accent | 58.955 | 79.766 | -26,1% |
| 83 | 99 | Audi Q5 | 57.640 | 49.550 | 16,3% |
| 84 | 82 | Chevrolet Suburban | 56.516 | 60.082 | -5,9% |
| 85 | 89 | Acura MDX | 54.886 | 55.495 | -1,1% |
| 86 | 97 | Mercedes GLE | 54.595 | 51.560 | 5,9% |
| 87 | 92 | Ford E-Series | 53.304 | 54.245 | -1,7% |
| 88 | 154 | Nissan Titan | 52.924 | 21.880 | 141,9% |
| 89 | 83 | Ford Expedition | 51.883 | 59.835 | -13,3% |
| 90 | 85 | Lexus ES | 51.398 | 58.299 | -11,8% |
| 91 | 95 | Acura RDX | 51.295 | 52.361 | -2,0% |
| 92 | 94 | Chrysler 300 | 51.237 | 53.241 | -3,8% |
| 93 | 112 | BMW X5 | 50.815 | 41.646 | 22,0% |
| 94 | 78 | Subaru Legacy | 49.837 | 65.306 | -23,7% |
| 95 | 88 | Honda Fit | 49.454 | 56.630 | -12,7% |
| 96 | 93 | GMC Yukon | 49.183 | 53.447 | -8,0% |
| 97 | 102 | Mercedes GLC | 48.643 | 47.872 | 1,6% |
| 98 | 98 | Mercedes E Class | 48.579 | 50.896 | -4,6% |
| 99 | 96 | Buick Enclave | 48.564 | 52.028 | -6,7% |
| 100 | 108 | Volkswagen Tiguan | 46.983 | 43.638 | 7,7% |


