Hong Kong Auto sales in 2019 declined from the previous year, despite an impressive first half. Indeed, Total sales in 2019 have been 38.180, down 9.6% from the previous year. Toyota dominated the market reaching 31.9% of share, while Tesla landed in 6th place.
Economic Environment
Hong Kong’s economy contracted by 1.2% for 2019 as a whole, the first annual decline since 2009. In the first half of 2019, the economy grew only modestly by 0.6% year-on-year amid softening global economic growth and elevated US-Mainland trade tensions. The economy then worsened abruptly and recorded sharp contractions of 2.8% and 2.9% respectively in the third and fourth quarters, as the local social incidents involving violence dealt a heavy blow to economic sentiment and consumption- and tourism-related activities.
Market Trend
In 2018, Hong Kong’s vehicles market reported a moderate fall after the previous’ year shy recovery, registering 42.222 units.
In 2019, the market started at an outstanding pace, while in the second half registrations fell sharply, dragging the Full-year on a negative path. Indeed, according to the Hong Kong Department of Transportations (HKDT), Total sales in 2019 have been 38.180, down 9.6% from the previous year.
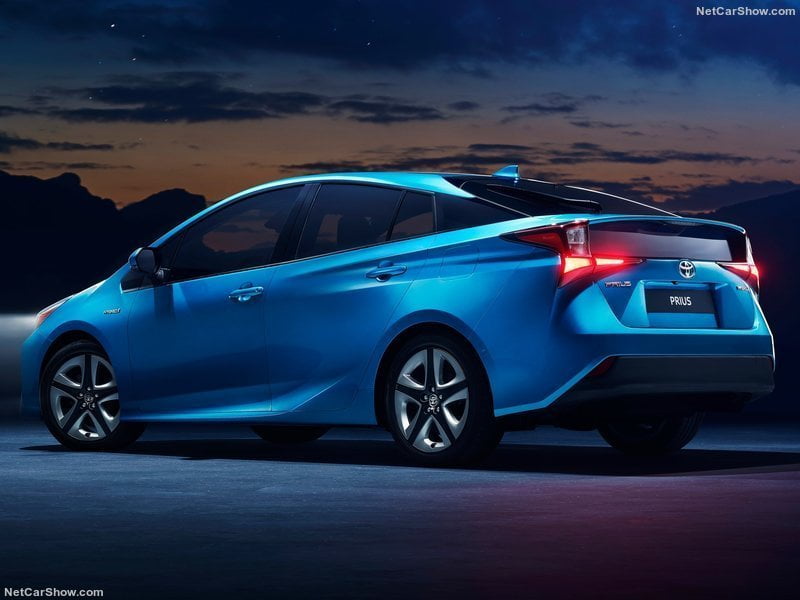
Brand-wise, Toyota consolidated the leadership – despite losing 5% – raising the market share at 31.9%, ending the year with 12.168 units sold.
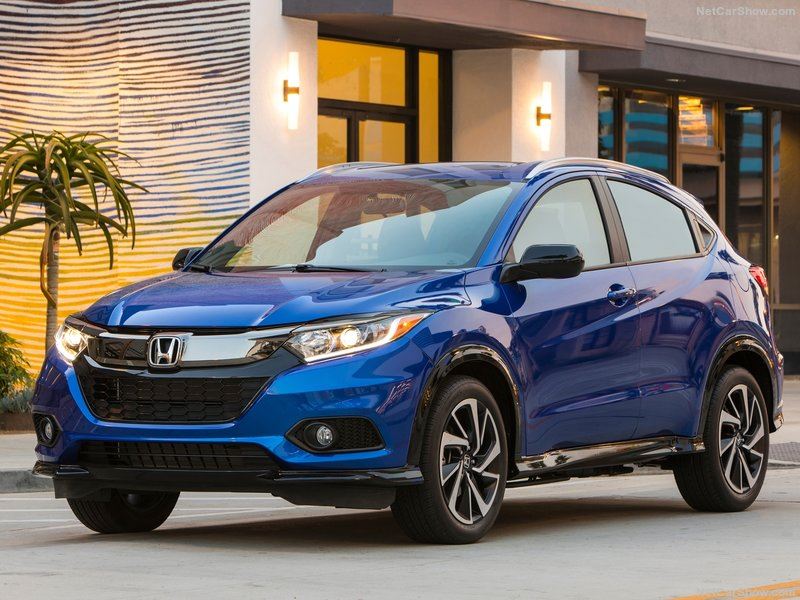
Mercedes held the second place ahead of Honda, but both brands dropped down by near 20%, holding respectively 12% and 10.6% of market share. In fourth place, BMW with 10%, ahead of Nissan with 4.4%, and the fast-growing Tesla.
Service Solutions
Since 2010, focus2move.com is a specialist in the automotive industry tracking monthly sales for all brands and models in the widest in the World range of countries, actually over 150. From this huge database we can extract data sorted under your own conditions and deliver historical data in excel.
If you like to receive historical data or to subscribe at monthly update, contact us at kventura@focus2move.com and we will arrange a short video call. By showing you our database and segmentation, we can find together the best solutions for your team.
| Rank 2019 | Rank 2018 | Brand | Sales 2019 | +/- YTD | Share 2019 |
|---|---|---|---|---|---|
| 1 | 1 | Toyota | 12.168 | -5,0% | 31,88% |
| 2 | 2 | Mercedes | 4.626 | -19,5% | 12,12% |
| 3 | 3 | Honda | 4.057 | -22,0% | 10,63% |
| 4 | 4 | BMW | 3.815 | -3,5% | 9,99% |
| 5 | 6 | Nissan | 1.682 | -0,4% | 4,41% |
| 6 | 24 | Tesla | 1.395 | 1062,5% | 3,65% |
| 7 | 8 | Lexus | 1.169 | -9,9% | 3,06% |
| 8 | 5 | Audi | 1.044 | -46,7% | 2,74% |
| 9 | 9 | Kia | 947 | -12,2% | 2,48% |
| 10 | 7 | Volkswagen | 944 | -39,8% | 2,47% |
| 11 | 10 | Porsche | 864 | -19,6% | 2,26% |
| 12 | 11 | Mazda | 734 | -25,4% | 1,92% |
| 13 | 16 | Suzuki | 677 | 121,2% | 1,77% |
| 14 | 12 | Land Rover | 541 | -24,9% | 1,42% |
| 14 | 14 | Subaru | 541 | -0,7% | 1,42% |
| 15 | 21 | Hyundai | 486 | 159,9% | 1,27% |
| 16 | 15 | Mini | 414 | -21,9% | 1,08% |
| 17 | 13 | Volvo | 400 | -33,4% | 1,05% |
| 18 | 20 | Infiniti | 251 | 27,4% | 0,66% |
| 19 | 19 | Mitsubishi | 214 | -13,0% | 0,56% |
| 20 | 17 | Jaguar | 184 | -33,6% | 0,48% |
| 21 | 18 | Maserati | 179 | -35,1% | 0,47% |
| 22 | 27 | Lamborghini | 171 | 163,1% | 0,45% |
| 23 | 22 | Bentley | 168 | -9,7% | 0,44% |
| 24 | 26 | Ferrari | 83 | 2,5% | 0,22% |
| 25 | 23 | Renault | 74 | -49,0% | 0,19% |
| 26 | 30 | McLaren | 67 | 55,8% | 0,18% |
| 27 | 29 | Rolls-Royce | 66 | 50,0% | 0,17% |
| 28 | 25 | Ford | 53 | -47,0% | 0,14% |
| 29 | 32 | Smart | 45 | 50,0% | 0,12% |
| 30 | 31 | Aston Martin | 33 | -5,7% | 0,09% |
| 31 | 35 | Jeep | 16 | 100,0% | 0,04% |
| 32 | 33 | Alfa Romeo | 14 | -26,3% | 0,04% |
| 33 | 34 | Peugeot | 13 | -13,3% | 0,03% |
| 34 | 34 | Lotus | 11 | -26,7% | 0,03% |
| 35 | 37 | Fiat | 8 | 300,0% | 0,02% |
| 36 | 38 | Dongfeng | 6 | 0,02% | |
| 37 | 38 | Alpine | 3 | 0,01% | |
| 37 | 36 | Maxus | 3 | -57,1% | 0,01% |
| 38 | 37 | Isuzu | 2 | 0,0% | 0,01% |
| 38 | 28 | SsangYong | 2 | -96,7% | 0,01% |
| Rank 2019 | Rank 2018 | Group | Sales 2019 | +/- 2019 | Share 2019 |
|---|---|---|---|---|---|
| 1 | 1 | Toyota Group | 13.337 | -5,5% | 34,93% |
| 2 | 2 | Mercedes Daimler | 4.671 | -19,2% | 12,23% |
| 3 | 5 | BMW | 4.295 | -5,1% | 11,25% |
| 4 | 3 | Honda Motor | 4.057 | -22,0% | 10,63% |
| 5 | 4 | Volkswagen Group | 3.191 | -34,2% | 8,36% |
| 6 | 6 | Renault Nissan Alliance | 2.224 | -2,3% | 5,83% |
| 7 | 7 | Hyundai-Kia | 1.433 | 13,2% | 3,75% |
| 8 | 14 | Tesla | 1.395 | 1062,5% | 3,65% |
| 9 | 9 | Mazda | 734 | -25,4% | 1,92% |
| 10 | 8 | Tata | 725 | -27,3% | 1,90% |


