Puerto Rico Vehicles Market 2016 grew moderately, despite the critical fiscal situation. Despite administratively this is under US, the consumer’s do not like to buy American. Toyota led ahead of Hyundai.
Puerto Rico’s debt saga is ongoing as Governor Ricardo Rosselló has been granted more time to submit a fiscal plan and to restructure USD 70 billion in debt, developments which are intended to bring the country back onto a sustainable economic path. For FY 2017, the FocusEconomics panelists expect GNP to contract 1.9%.
The new vehicles market in 2016 came back to the sales level of the 2011 with a moderate increase, following two years of negative performances. Indeed, according to data released by local authorities in the full year the vehicles sold have been 88.193, up 5.4%.
Being an unincorporated state of the United States, Puerto Rico sales figures aren’t included in the monthly U.S. totals and analysis.
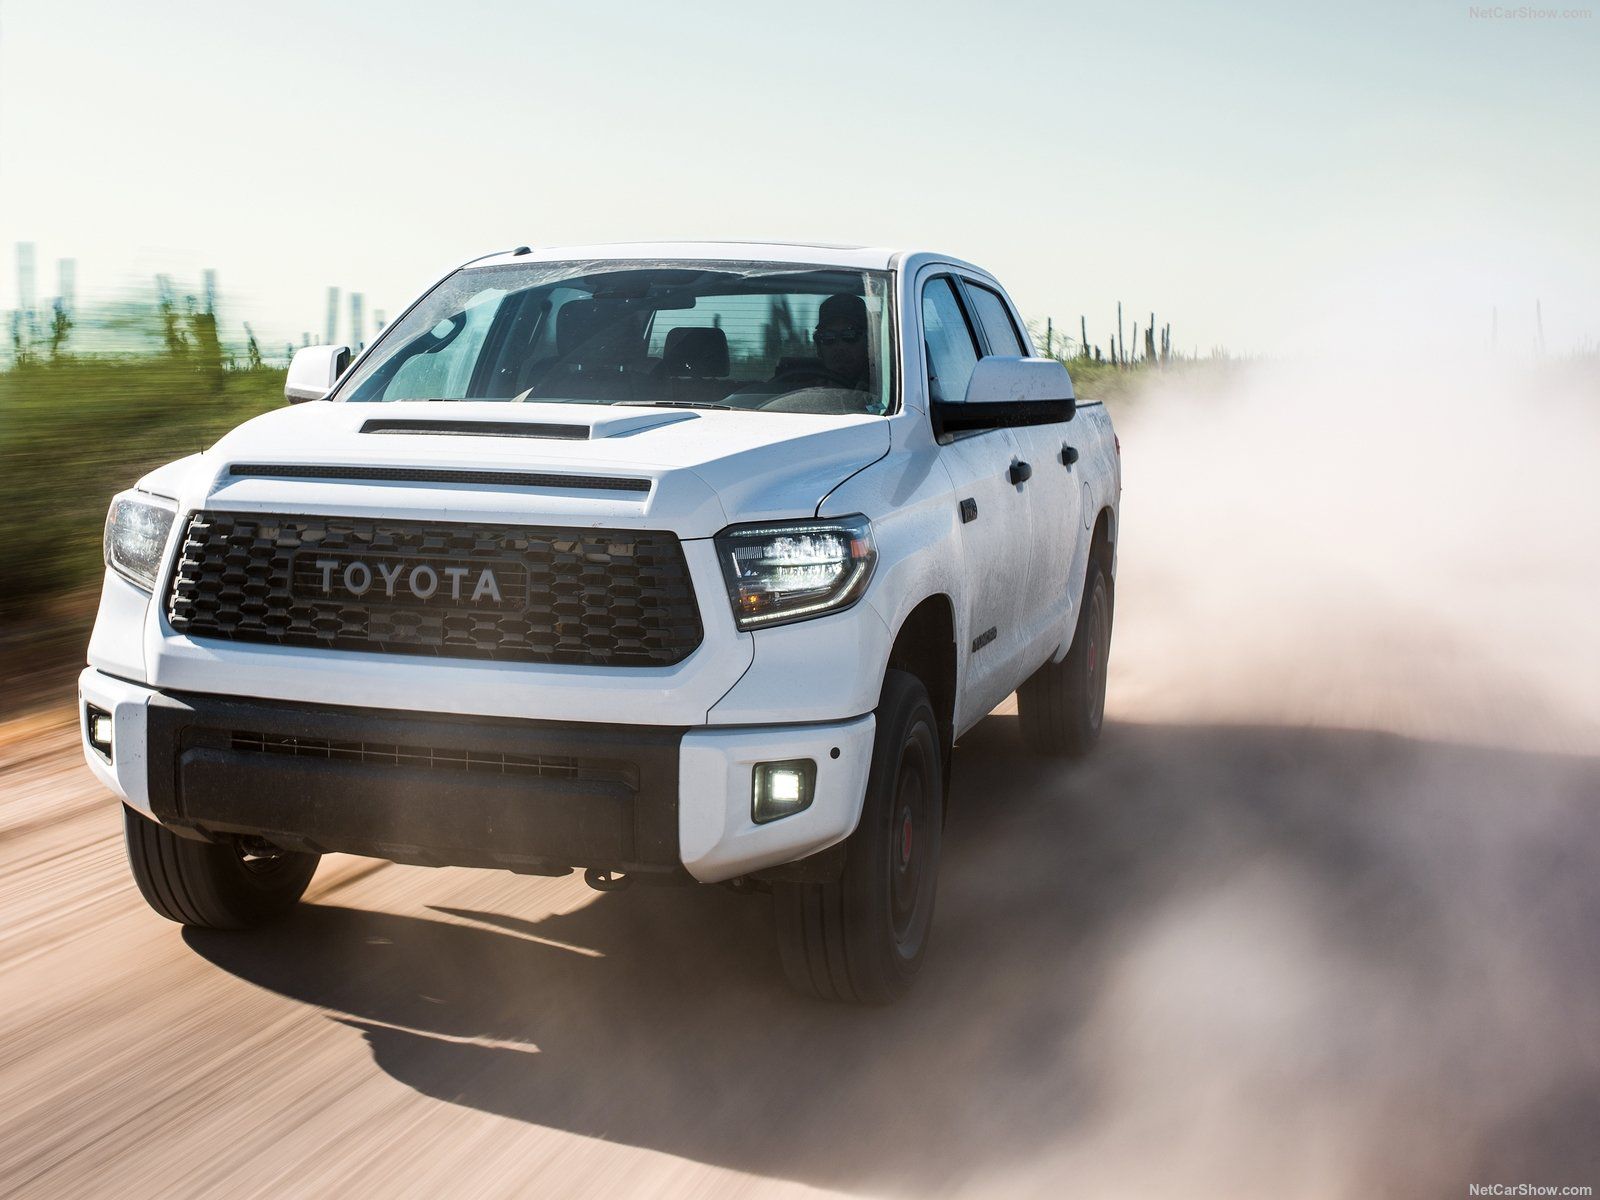
Toyota kept the leadership scoring 23.293 units (+6.0%), the double of Hyundai, which was second with the best increase of 2016, up 25.3% at 11.634. Kia confirmed the third step of the podium with 8.842 units (+2.0%), while the overtaking of Honda ahead of Mitsubishi was the only change in the top 10 on 2015.
The highest growths of the year were reported for Nissan (+10.5%) and Honda (+10.2%), while Dodge was the worst losing 39.8%.
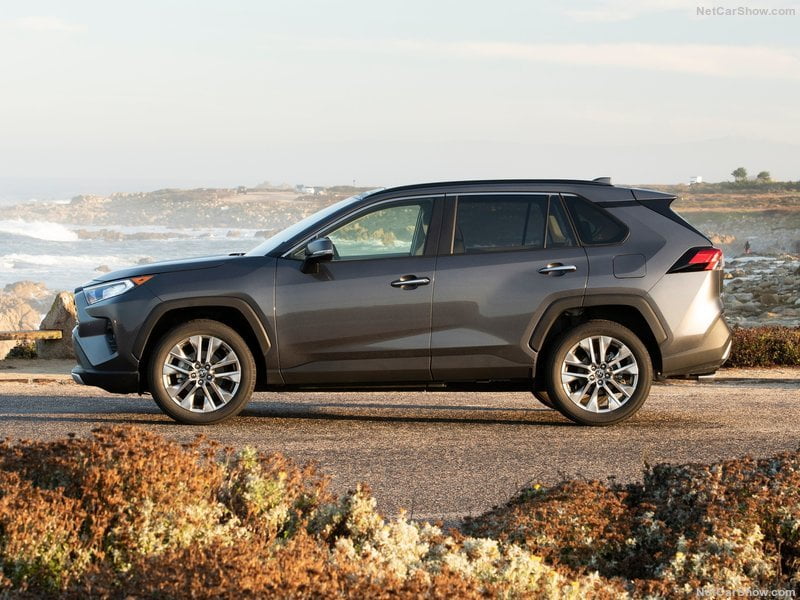
The Toyota Yaris was the new best-selling model with 7.787 sales (+44.3%), outpacing the Toyota Corolla with 4.590 (-35.9%). The Toyota RAV4 ranked third with 3.674 units (+32.7%), jumping from the fifth place.
Below, you can sort our interactive tables to see data regarding Brands, Groups and Models. Please bear in mind that sales data are subject to adjustments as sources will update their information. This report is updated at the publishing date and will not be modified while the next on this subject will always have the year to date data updated.
| Rank 2016 | Rank 2015 | BRAND | Sales 2016 | Sales 2015 | Variation 2016 | Share 2016 | Share 2015 |
|---|---|---|---|---|---|---|---|
| 1 | 1 | Toyota | 23.293 | 21.980 | 6,0% | 26,2% | 24,1% |
| 2 | 2 | Hyundai | 11.634 | 9.283 | 25,3% | 13,1% | 10,2% |
| 3 | 3 | Kia | 8.842 | 8.665 | 2,0% | 9,9% | 9,5% |
| 4 | 4 | Nissan | 8.725 | 7.894 | 10,5% | 9,8% | 8,7% |
| 5 | 6 | Ford | 6.282 | 6.710 | -6,4% | 7,1% | 7,4% |
| 6 | 7 | Jeep | 5.670 | 5.334 | 6,3% | 6,4% | 5,9% |
| 7 | 9 | Honda | 4.864 | 4.412 | 10,2% | 5,5% | 4,8% |
| 8 | 8 | Mitsubishi | 4.757 | 4.619 | 3,0% | 5,3% | 5,1% |
| 9 | 34 | Ram | 2.957 | - | #DIV/0! | 3,3% | 0,0% |
| 10 | 10 | Mazda | 1.845 | 2.382 | -22,5% | 2,1% | 2,6% |
| 11 | 13 | Mercedes | 1.354 | 1.247 | 8,6% | 1,5% | 1,4% |
| 12 | 14 | BMW | 1.206 | 1.134 | 6,3% | 1,4% | 1,2% |
| 13 | 12 | Chevrolet | 1.080 | 1.341 | -19,5% | 1,2% | 1,5% |
| 14 | 15 | Lexus | 1.076 | 1.108 | -2,9% | 1,2% | 1,2% |
| 15 | 17 | Acura | 821 | 856 | -4,1% | 0,9% | 0,9% |
| 16 | 16 | Scion | 797 | 907 | -12,1% | 0,9% | 1,0% |
| 17 | 20 | Infiniti | 549 | 544 | 0,9% | 0,6% | 0,6% |
| 18 | 19 | Mini | 527 | 557 | -5,4% | 0,6% | 0,6% |
| 19 | 11 | Dodge | 520 | 2.160 | -75,9% | 0,6% | 2,4% |
| 20 | 18 | Volkswagen | 447 | 609 | -26,6% | 0,5% | 0,7% |
| 21 | 21 | Fiat | 308 | 380 | -18,9% | 0,3% | 0,4% |
| 22 | 23 | Audi | 252 | 231 | 9,1% | 0,3% | 0,3% |
| 23 | 24 | Porsche | 238 | 230 | 3,5% | 0,3% | 0,3% |
| 24 | 22 | Land Rover | 220 | 238 | -7,4% | 0,2% | 0,3% |
| 25 | 5 | Chrysler | 147 | 7.813 | |||
| 26 | 25 | Subaru | 139 | 131 | |||
| 27 | 26 | GMC | 120 | 108 | |||
| 28 | 31 | Jaguar | 63 | 23 | |||
| 29 | 30 | Volvo | 59 | 26 | |||
| 30 | 34 | Lincoln | 54 | - | |||
| 31 | 27 | Smart | 51 | 80 | |||
| 32 | 29 | Buick | 43 | 60 | |||
| 33 | 28 | Cadillac | 36 | 72 | |||
| 34 | 32 | Maserati | 30 | 19 | |||
| 35 | 33 | Ferrari | 7 | 9 | |||
| 36 | 34 | Alfa Romeo | 6 | - |
| Rank 2016 | Rank 2015 | Group | Sales 2015 | Sales 2016 | Variation 2016 | Share 2016 | Share 2015 |
|---|---|---|---|---|---|---|---|
| 1 | 1 | Toyota | 23.995 | 25.166 | 4,9% | 28,3% | 26,3% |
| 2 | 2 | Hyundai-Kia | 17.948 | 20.476 | 14,1% | 23,0% | 19,7% |
| 3 | 3 | FCA | 15.715 | 9.645 | -38,6% | 10,8% | 17,2% |
| 4 | 4 | Renault-Nissan | 8.438 | 9.274 | 9,9% | 10,4% | 9,3% |
| 5 | 5 | Ford | 6.710 | 6.336 | -5,6% | 7,1% | 7,4% |
| 6 | 6 | Honda | 5.268 | 5.685 | 7,9% | 6,4% | 5,8% |
| 7 | 7 | Mitsubishi | 4.619 | 4.757 | 3,0% | 5,3% | 5,1% |
| 8 | 8 | Mazda | 2.382 | 1.845 | -22,5% | 2,1% | 2,6% |
| 9 | 9 | BMW | 1.691 | 1.733 | 2,5% | 1,9% | 1,9% |
| 10 | 11 | Mercedes Daimler | 1.327 | 1.405 | 5,9% | 1,6% | 1,5% |
| Rank 2016 | Rank 2015 | Model | Sales 2016 | Sales 2015 | 2016 Variation |
|---|---|---|---|---|---|
| 1 | 2 | Toyota Yaris | 7.787 | 5.398 | 44,3% |
| 2 | 1 | Toyota Corolla | 4.590 | 7.159 | -35,9% |
| 3 | 5 | Toyota RAV4 | 3.674 | 2.768 | 32,7% |
| 4 | 8 | Toyota Tacoma | 3.614 | 2.347 | 54,0% |
| 5 | 9 | Hyundai Tucson | 3.488 | 2.294 | 52,0% |
| 6 | 14 | Hyundai Elantra | 3.305 | 1.801 | 83,5% |
| 7 | 4 | Kia Rio | 3.156 | 2.996 | 5,3% |
| 8 | 3 | Hyundai Accent | 3.131 | 3.279 | -4,5% |
| 9 | 11 | Jeep Wrangler | 2.661 | 2.072 | 28,4% |
| 10 | 12 | Nissan Versa | 2.456 | 1.855 | 32,4% |
| 11 | 10 | Kia Soul | 2.350 | 2.243 | 4,8% |
| 12 | 7 | Nissan Rogue | 2.222 | 2.397 | -7,3% |
| 13 | 6 | Mitsubishi Mirage | 2.214 | 2.466 | -10,2% |
| 14 | 24 | Mitsubishi Outlander | 2.005 | 783 | 156,1% |
| 15 | 15 | Nissan Sentra | 1.993 | 1.669 | 19,4% |
| 16 | 13 | Toyota Highlander | 1.693 | 1.852 | -8,6% |
| 17 | 16 | Kia Forte | 1.297 | 1.369 | -5,3% |
| 18 | 17 | Kia Sportage | 1.254 | 1.127 | 11,3% |
| 19 | 18 | Jeep Grand Cherokee | 1.173 | 1.090 | 7,6% |
| 20 | 27 | Jeep Patriot | 1.077 | 735 | 46,5% |
| 21 | 23 | Ram Pick-up | 1.040 | 838 | 24,1% |
| 22 | 28 | Ford F-Series | 1.007 | 718 | 40,3% |
| 23 | 34 | Ford Escape | 921 | 611 | 50,7% |
| 24 | 20 | Honda Accord | 914 | 921 | -0,8% |
| 25 | 29 | Ford Explorer | 828 | 695 | 19,1% |
| 26 | 19 | Honda Civic | 825 | 1.028 | -19,7% |
| 27 | 22 | Honda CR-V | 810 | 855 | -5,3% |
| 28 | 39 | Honda Pilot | 753 | 517 | 45,6% |
| 29 | 26 | Ford Transit connect | 678 | 736 | -7,9% |
| 30 | 25 | Ford Transit | 651 | 743 | -12,4% |
| 31 | 33 | Hyundai Veloster | 558 | 617 | -9,6% |
| 32 | 37 | Hyundai Sonata | 550 | 576 | -4,5% |
| 33 | 32 | Jeep Compass | 545 | 625 | -12,8% |
| 34 | 38 | Ford Edge | 544 | 522 | 4,2% |
| 35 | 36 | Nissan Murano | 540 | 597 | -9,5% |
| 36 | 30 | Mitsubishi Lancer | 538 | 692 | -22,3% |
| 37 | 21 | Mazda CX-5 | 520 | 889 | -41,5% |
| 38 | 40 | Hyundai Santa fe | 513 | 492 | 4,3% |
| 39 | 32 | Mazda3 | 449 | 625 | -28,2% |
| 40 | 103 | Lexus NX | 446 | 69 | 546,4% |


