Malaysian Vehicles Market in 2018 improved by 3.8% from last year’s performance, closing with registrations at 598.742. Perodua, the market leader with 38% of market share, is followed by Honda and Toyota. Outstanding performance was scored by Mazda, up 64.8%.
Economic Environment
Recent economic data has been largely underwhelming, even though retail sales continued growing at a robust pace in October and November as consumers benefited from low inflation. Export growth came to a virtual standstill in November on a sharp contraction in shipments of palm oil and palm oil-based products, offsetting a jump in foreign demand for refined petroleum products. Meanwhile, import growth eased on softer demand for consumption goods.
he economy should continue growing at a robust pace this year owing to firm domestic demand. However, while fixed investment growth is expected to pick up, private consumption will likely moderate after its stellar performance in 2018. Lingering global trade tensions and financial-market volatility are the main downside risks to the outlook.
Market Trend
Malaysian vehicles market grew up uninterruptedly from 2012 to 2015 hitting the all-time record with 666.000 units, before to decline in the 2016 at 583.000 and again in the 2017. Indeed, according to data released by the M.A.A., the Malaysian Automotive Association, total vehicles sales in 2017 have been 576.658 (-0.8%).
In the 2018 the market is actually positive, pushed up by the temporary removal of the 6% Goods and Services Tax (GST) on all car purchases since June. Indeed, the market increased by 3.8% from last year, ending with registrations at 598.742.
| Market | Sales 2014 | Sales 2015 | Sales 2016 | Sales 2017 | Sales 2018 | '+/- 2018 |
|---|---|---|---|---|---|---|
| Car+LCV | 640.306 | 643.517 | 569.191 | 565.874 | 586.494 | 3,6% |
| HCV | 26.149 | 23.228 | 14.028 | 10.784 | 12.248 | 13,6% |
| Total | 666.455 | 666.745 | 583.219 | 576.658 | 598.742 | 3,8% |
Competitive Arena
Brand wise, the 2018 market leader is Perodua, selling 227.243 vehicles (+10.9%) with 38% of market share.
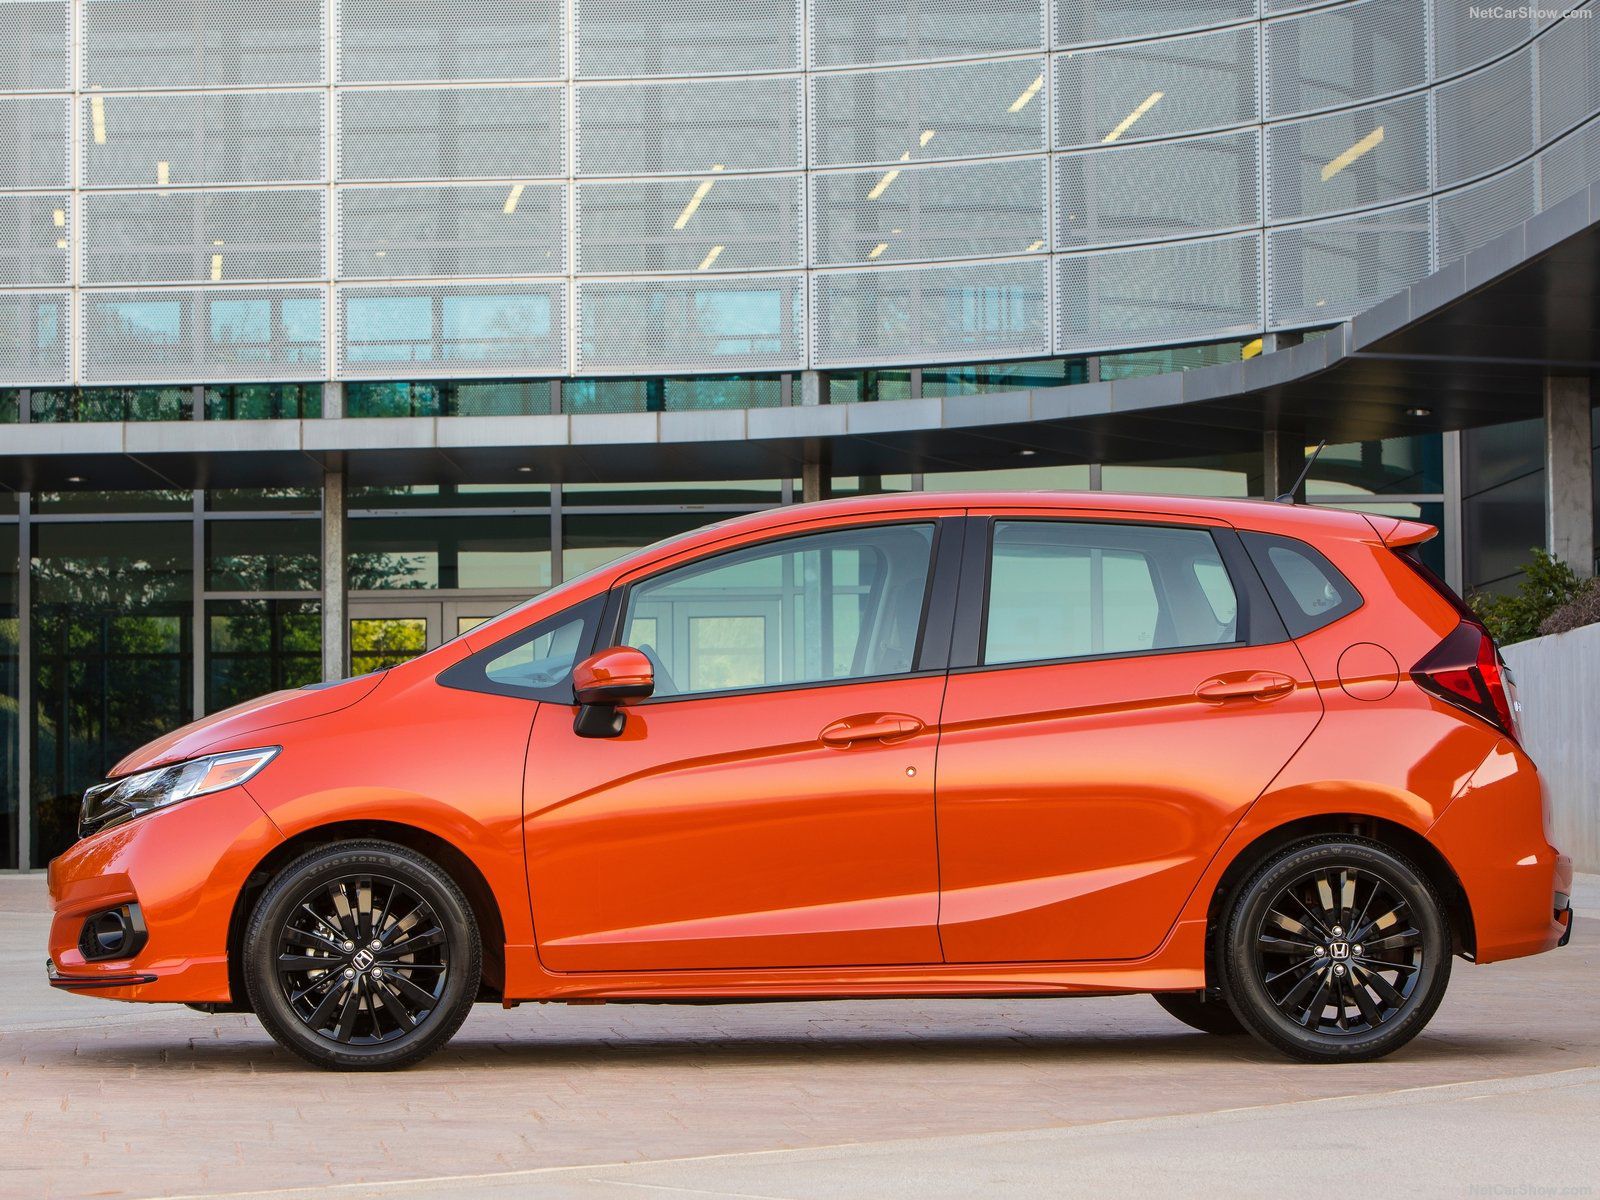
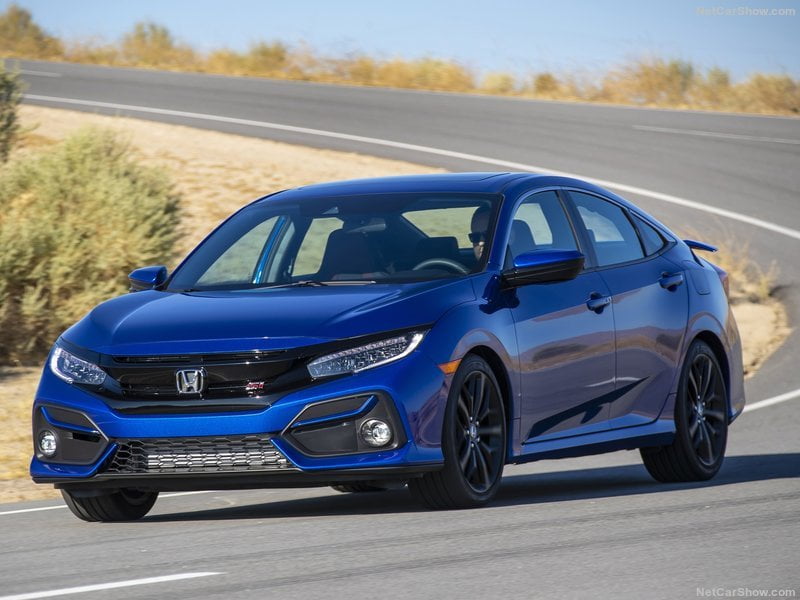
In second place Honda with 102.282 units (-6.6%) followed by Toyota with 65.551 (-5.7%), Proton with 64.744 (-8.8%), Nissan with 28.610 (+5.4%), Mazda with 16.038 (+64.8%), Mercedes with 13.463 (+10.6%) and BMW with 12.008 (+13.1%).
You could have access to the Best-selling models ranking in the link.
Research, Consulting, Data & Forecast Store
F2M covers intensively this market with several products developed to help any investigation required. Market Researches in PDF are immediately available for download with study on the market since 2005 and with forecast up to the 2025. AutoData in EXCEL are immediately downloadable with annual sales volume, split by month, for all brands and all models distributed in the market. This year data are released year to date, but you will receive a monthly update until the year-end. See details within Malaysia Corner Store
| Rank 2018 | Rank 2017 | Sales 2018 | Sales 2017 | '+/- 2018 | Share 2018 | |
|---|---|---|---|---|---|---|
| 1 | 1 | Perodua | 227.243 | 204.887 | 10,9% | 38,0% |
| 2 | 2 | Honda | 102.282 | 109.511 | -6,6% | 17,1% |
| 3 | 4 | Toyota | 65.551 | 69.521 | -5,7% | 10,9% |
| 4 | 3 | Proton | 64.744 | 70.992 | -8,8% | 10,8% |
| 5 | 5 | Nissan | 28.610 | 27.154 | 5,4% | 4,8% |
| 6 | 9 | Mazda | 16.038 | 9.730 | 64,8% | 2,7% |
| 7 | 6 | Mercedes | 13.463 | 12.173 | 10,6% | 2,2% |
| 8 | 8 | BMW | 12.008 | 10.618 | 13,1% | 2,0% |
| 9 | 7 | Isuzu | 11.178 | 10.973 | 1,9% | 1,9% |
| 10 | 10 | Mitsubishi | 9.261 | 7.034 | 31,7% | 1,5% |
| 11 | 11 | Volkswagen | 7.001 | 6.445 | 8,6% | 1,2% |
| 12 | 12 | Ford | 6.255 | 6.255 | 0,0% | 1,0% |
| 13 | 13 | Hino | 5.808 | 5.002 | 16,1% | 1,0% |
| 14 | 15 | Kia | 5.658 | 4.131 | 37,0% | 0,9% |
| 15 | 14 | Subaru | 5.175 | 4.782 | 8,2% | 0,9% |
| 16 | 16 | Hyundai | 2.949 | 4.110 | -28,2% | 0,5% |
| 17 | 17 | Mitsubishi Fuso | 2.307 | 2.170 | 6,3% | 0,4% |
| 18 | 18 | Peugeot | 2.302 | 1.924 | 19,6% | 0,4% |
| 19 | 19 | Volvo | 1.384 | 1.021 | 35,6% | 0,2% |
| 20 | 20 | Mini | 1.200 | 1.011 | 18,7% | 0,2% |
| 21 | 21 | Lexus | 1.011 | 953 | 6,1% | 0,2% |
| 22 | 25 | Renault | 1.009 | 592 | 70,4% | 0,2% |
| 23 | 23 | Daihatsu | 991 | 803 | 23,4% | 0,2% |
| 24 | 22 | UD Trucks | 676 | 865 | -21,8% | 0,1% |
| 25 | 47 | Sinotruck | 652 | 2 | 0,1% | |
| 26 | 27 | Scania | 562 | 482 | 16,6% | 0,1% |
| 27 | 29 | Volvo Trucks | 447 | 380 | 17,6% | 0,1% |
| 28 | 31 | CAMC | 442 | 209 | 111,5% | 0,1% |
| 28 | 48 | CAM | 442 | - | 0,1% | |
| 29 | 28 | Porsche | 342 | 395 | -13,4% | 0,1% |
| 30 | 32 | Mercedes Trucks | 295 | 173 | 70,5% | |
| 31 | 26 | Chevrolet | 234 | 499 | -53,1% | |
| 32 | 33 | Land Rover | 216 | 161 | 34,2% | |
| 33 | 35 | BISON | 212 | 123 | 72,4% | |
| 34 | 30 | Man | 180 | 240 | -25,0% | |
| 35 | 24 | Audi | 150 | 701 | -78,6% | |
| 36 | 48 | King Long | 118 | - | ||
| 37 | 36 | Chana | 77 | 95 | -18,9% | |
| 38 | 37 | JAC | 59 | 74 | -20,3% | |
| 39 | 39 | Auman | 57 | 54 | 5,6% | |
| 40 | 40 | Tata | 53 | 53 | 0,0% |
| Rank 2018 | Rank 2017 | Sales 2018 | Sales 2017 | '+/- 2018 | Share 2018 | |
|---|---|---|---|---|---|---|
| 1 | 1 | Perodua | 227.243 | 204.887 | 10,9% | 38,0% |
| 2 | 2 | Honda Motor | 102.282 | 109.511 | -6,6% | 17,1% |
| 3 | 3 | Toyota Group | 73.361 | 76.279 | -3,8% | 12,3% |
| 4 | 4 | Geely Group | 66.128 | 72.013 | -8,2% | 11,0% |
| 5 | 5 | Renault Nissan Alliance | 38.880 | 34.780 | 11,8% | 6,5% |
| 6 | 9 | Mazda | 16.038 | 9.730 | 64,8% | 2,7% |
| 7 | 6 | Mercedes Daimler | 15.770 | 14.343 | 9,9% | 2,6% |
| 8 | 7 | BMW | 13.208 | 11.629 | 13,6% | 2,2% |
| 9 | 8 | Isuzu Motors | 11.178 | 10.973 | 1,9% | 1,9% |
| 10 | 11 | Hyundai-Kia | 8.607 | 8.241 | 4,4% | 1,4% |


