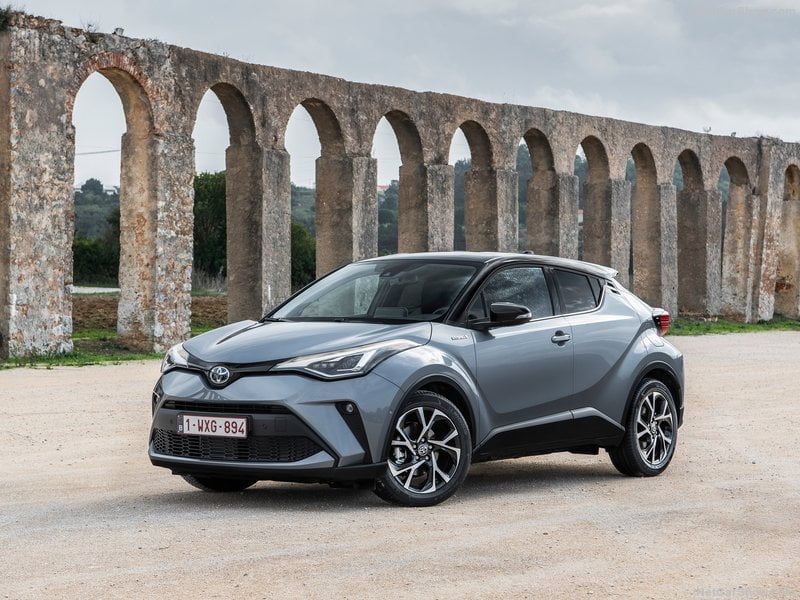
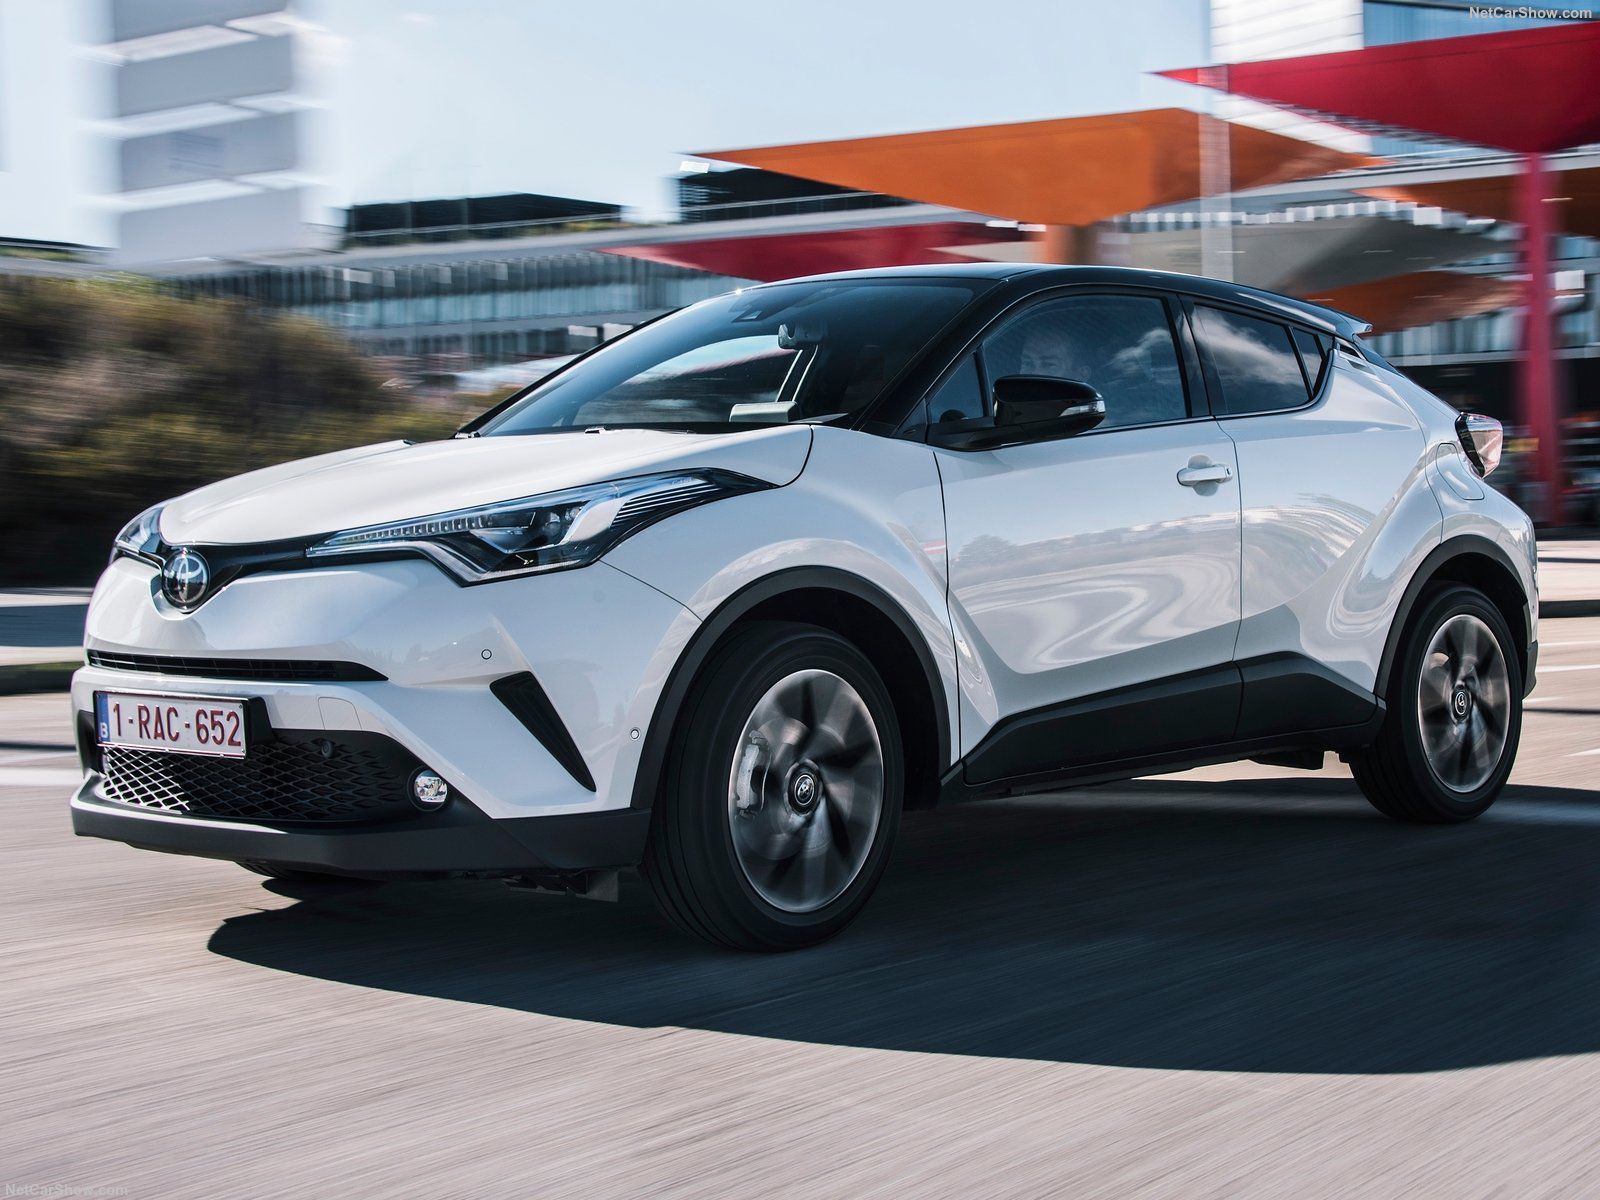
Estonian Cars Market in 2019 has kept momentum, hitting the fourth consecutive year of growth. Indeed, Total sales have been 29.888, improving 5.9% from the previous year. Toyota was on top of the ranking, holding 15.9% of share, followed by Skoda and Renault.
Economic Environment
Estonian economic growth accelerated in the third quarter, led by a marked improvement in the external sector as export growth more than doubled and imports cooled. On a less positive note, domestic demand hit another speedbump in Q3. Household spending halved and fixed investment decelerated sharply in the quarter chiefly due to contracting public investment activity and a slowing inflow of EU development funds; public spending, however, jumped.
Turning to the fourth quarter, private sector conditions seem to have weakened as industrial output contracted in October and business confidence dipped to an over four-year low in November. In addition, slumping retail sales in October and deteriorating consumer sentiment in October–November suggest consumer spending lost further traction in the quarter.
Market Trend
Estonian Automotive industry has been solid in recent years. In 2017 the car passenger’s sales have been 25.672 – up 11.8% – holding a positive tone also in 2018.
In 2019, according to data released by the Estonian Road Administration (E.R.A.), the market hit the fourth consecutive year of growth. Indeed, Total sales have been 29.888, improving 5.9% from the previous year.
At brand-wise, Toyota was on top of the ranking, holding 15.9% of share, followed by Skoda and Renault, respectively with 13.8% and 9.2% of market share.
Service Solutions
Since 2010, focus2move.com is a specialist in the automotive industry tracking monthly sales for all brands and models in the widest in the World range of countries, actually over 150. From this huge database we can extract data sorted under your own conditions and deliver historical data in excel.
If you like to receive historical data or to subscribe at monthly update, contact us at kventura@focus2move.com and we will arrange a short video call. By showing you our database and segmentation, we can find together the best solutions for your team.
| Rank 2019 | Brand | Sales YTD 2019 | Sales December | +/- YTD 2019 | Share 2019 | Share December |
|---|---|---|---|---|---|---|
| 1 | Toyota | 4.263 | 420 | 3,8% | 15,86% | 16,68% |
| 2 | Skoda | 3.704 | 311 | 2,2% | 13,78% | 12,36% |
| 3 | Renault | 2.463 | 278 | 4,0% | 9,16% | 11,04% |
| 4 | Volkswagen | 2.070 | 100 | -8,9% | 7,70% | 3,97% |
| 5 | Kia | 2.001 | 203 | 15,5% | 7,44% | 8,07% |
| 6 | Peugeot | 1.503 | 152 | 26,5% | 5,59% | 6,05% |
| 7 | Citroen | 1.352 | 64 | 40,4% | 5,03% | 2,52% |
| 8 | Dacia | 1.079 | 117 | 1,9% | 4,02% | 4,64% |
| 9 | Honda | 994 | 136 | -25,5% | 3,70% | 5,40% |
| 10 | Subaru | 885 | 62 | -8,5% | 3,29% | 2,47% |
| 11 | Opel | 850 | 118 | -18,2% | 3,16% | 4,69% |
| 12 | Nissan | 681 | 72 | -27,3% | 2,53% | 2,88% |
| 13 | Hyundai | 651 | 60 | -53,9% | 2,42% | 2,38% |
| 14 | Audi | 511 | 52 | -3,5% | 1,90% | 2,07% |
| 15 | Mazda | 505 | 58 | -25,5% | 1,88% | 2,32% |
| 16 | Seat | 472 | 32 | 100,5% | 1,76% | 1,27% |
| 17 | Mercedes | 448 | 23 | -20,7% | 1,67% | 0,91% |
| 18 | Ford | 434 | 55 | -30,5% | 1,61% | 2,17% |
| 19 | BMW | 393 | 52 | -16,2% | 1,46% | 2,07% |
| 20 | Volvo | 367 | 30 | -9,6% | 1,37% | 1,19% |
| 21 | Fiat | 251 | 20 | 178,5% | 0,93% | 0,79% |
| 22 | Suzuki | 180 | 15 | -22,9% | 0,67% | 0,61% |
| 23 | Lexus | 168 | 27 | -15,4% | 0,62% | 1,06% |
| 24 | Mitsubishi | 134 | 11 | -31,9% | 0,50% | 0,44% |
| 25 | Porsche | 127 | 10 | -35,6% | 0,47% | 0,40% |
| 26 | Land Rover | 100 | 22 | -53,8% | 0,37% | 0,86% |
| 27 | Mini | 66 | 5 | -27,7% | 0,25% | 0,20% |
| 28 | DS | 41 | - | 3,1% | 0,15% | 0,00% |
| 29 | Jeep | 39 | 3 | 15,5% | 0,15% | 0,10% |
| 30 | SsangYong | 34 | 1 | 90,6% | 0,13% | 0,04% |
| 31 | Jaguar | 34 | 3 | -50,9% | 0,13% | 0,12% |
| 32 | Alfa Romeo | 18 | 2 | -75,6% | 0,07% | 0,08% |
| 33 | Maserati | 13 | 1 | 30,0% | 0,05% | 0,04% |
| 34 | Dodge | 13 | 2 | 0,05% | 0,08% | |
| 35 | Bentley | 10 | - | 333,7% | 0,04% | 0,00% |
| 36 | Chrysler | 9 | - | -95,4% | 0,03% | 0,00% |
| 37 | Infiniti | 6 | - | 15,5% | 0,02% | 0,00% |
| 38 | Ferrari | 3 | - | 197,3% | 0,01% | 0,00% |
| 39 | Tesla | 3 | 1 | -92,2% | 0,01% | 0,04% |
| 40 | Cadillac | 3 | - | -42,3% | 0,01% | 0,00% |
| 41 | Rolls-Royce | 1 | - | 15,5% | 0,00% | 0,00% |
| 42 | Aston Martin | 1 | - | 15,5% | 0,00% | 0,00% |
| 43 | Lamborghini | 1 | - | 15,5% | 0,00% | 0,00% |
| Rank 2019 | Group | Sales YTD 2019 | Sales December | +/- YTD 2019 | Share 2019 | Share December |
|---|---|---|---|---|---|---|
| 1 | Volkswagen Group | 6.895 | 505,527 | 0,5% | 25,65% | 20,07% |
| 2 | Toyota Group | 4.431 | 446,6805 | 2,9% | 16,48% | 17,74% |
| 3 | Renault Nissan Alliance | 4.364 | 478,3045 | -4,5% | 16,23% | 18,99% |
| 4 | P.S.A. | 3.746 | 334,1415 | 16,0% | 13,93% | 13,27% |
| 5 | Hyundai-Kia | 2.652 | 263,28 | -15,7% | 9,87% | 10,45% |
| 6 | Honda Motor | 994 | 135,9435 | -25,5% | 3,70% | 5,40% |
| 7 | Subaru | 885 | 62,2545 | -8,5% | 3,29% | 2,47% |
| 8 | Mazda | 505 | 58,443 | -25,5% | 1,88% | 2,32% |
| 9 | BMW | 461 | 57,0905 | -18,0% | 1,71% | 2,27% |
| 10 | Mercedes Daimler | 448 | 22,869 | -20,7% | 1,67% | 0,91% |
| Rank 2019 | Rank 2018 | Model | YTD 2019 | YTD 2019 Var | December Sales | December var |
|---|---|---|---|---|---|---|
| 1 | 3 | Toyota RAV4 | 1.593 | 58,8% | 133 | 46,2% |
| 2 | Toyota Corolla | 1.273 | 106 | |||
| 3 | 2 | Skoda Octavia | 1.240 | 21,0% | 103 | 24,1% |
| 4 | 1 | Renault Clio | 1.050 | 0,1% | 88 | 76,0% |
| 5 | Skoda Kodiaq | 809 | 67 | |||
| 6 | 10 | Kia Sportage | 644 | -2,9% | 54 | -32,5% |
| 7 | 9 | Renault Captur | 593 | -10,8% | 49 | 188,2% |
| 8 | 13 | Kia Ceed | 585 | -1,8% | 49 | 6,5% |
| 9 | 12 | Skoda Superb | 531 | -16,6% | 44 | 4,8% |
| 10 | 26 | Volkswagen Tiguan | 518 | 113,2% | 43 | 760,0% |


