
UK auto market in 2020 falls by 29.4% as the pandemic and lockdowns affect sales (not considering BREXIT). Full-Year sales have been 1.63 Million, the lowest annual volume since 1992. EU and government incentives boost AFV sales significantly. Diesel sales plummet (-55%) while MHEV sales soar an impressive 137.4%.
Market Trend
The UK car market was hit extremely harshly in 2020 as the global pandemic has impacted sales tremendously. In fact, the fall was so harsh that we recorded the lowest annual volume for the country since 1992.
The referendum on BREXIT in 2016 found the national automotive industry on the top of its glorious history. Following five years of consecutive growth, the light vehicles market hit in that year the All-Time record sales with 3.06 million units and was the fourth largest in the World.
After the referendum, the industry trend mirrored the British economy and a prolonged decline started. Indeed, the light vehicles market fell down both in 2017 and 2018, while the rest of Europe was growing without uncertainty, and in 2018 sales have been 2.72 million, of which 2.36 were car passengers. In 2019, registrations fell at the lower level out of the last 5 years, with 2.64 units sold.
The finally defined BREXIT process, created alarm of economic outlook with deep effects on the relevant automotive industry and fears for production activity shift from the UK to the continent, as already decided by Honda and JLR.
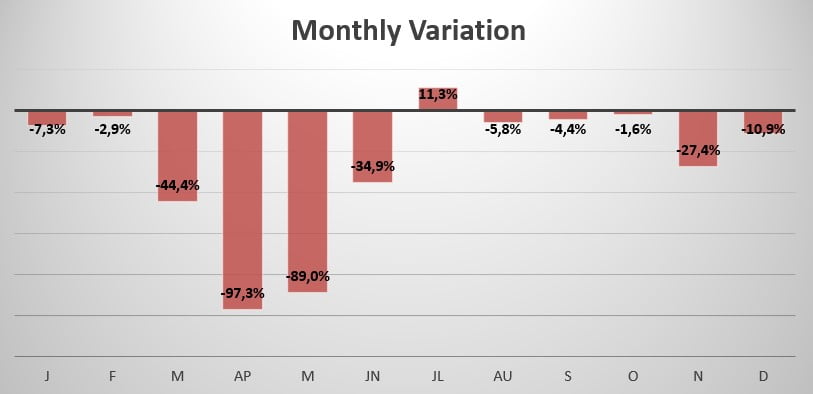
After starting the year with a slight negative trend (-7.3%) due to future fears about a trade deal, the market quickly collapsed in March (-44.4%) as the virus struck. The sharpest drop in sales this year was in April when sales declined by 97.3% as the market was impacted by restrictions on travel and lockdowns. After recovering, in June the market reported the only growth of the year (+11.3%), but sales remained negative in the following months and even fell in double digits for the last 2 months of the year as the second wave hampered the country.
Indeed, Full-Year sales for 2020 have been 1.631.064, reporting a decline of 29.4% compared to 2019.
Looking at fuel types, petrol sales are off -39% to 903.961 and 55.4% share vs. 64.1% a year ago, diesel is down -55% to 261.772 and 16% share vs. 25.2%, Mild Hybrid (MHEV) soars 137.4% to 180.132 and 11% share vs. 3.3% last year, HEV is up 12.1% to 110.117 and 6.8% share vs. 4.3%, BEV up 185.9% to 108.205 and 6.6% share vs. 1.6% and PHEV up 91.2% to 66.877 and 4.1% share vs. 1.5%.
Brand-wise, this year the leader Ford (-35.3%) lost 0.9% market share, followed by Volkswagen (-26.1%), which gained 0.4% share. BMW on the other hand jumped 1 spot and lost 0.3% share, falling 32%. Mercedes lost 35.5%, followed by Audi -up 1 spot- which lost 22.4%.
Opel (Vauxhall) registered the worst performance in the leaderboard by losing 37.9%, followed by Toyota which on the other hand reported the best performance (-12.7%), and Nissan which jumped 1 spot and lost 22.1% sales. Closing the leaderboard we have Kia -down 1 spot- losing 27.5% this year and Skoda entering the leaderboard by jumping 3 spots, losing 21.8%.
The most sold vehicle for 12 consecutive years has been the Ford Fiesta (-36.8%) with 49.174 units sold, followed by the Opel Corsa -up 2 spots-, which lost 12% registering 47.706 new sales this year. The Volkswagen Golf (-26.9%) closes the podium -falling 1 spot- and reports 43.109 units sold.
Tables with sales figures
In the tables below we report sales for top 40 Brands, top 10 Manufacturers Group and top 10 Models.


")
")

")
