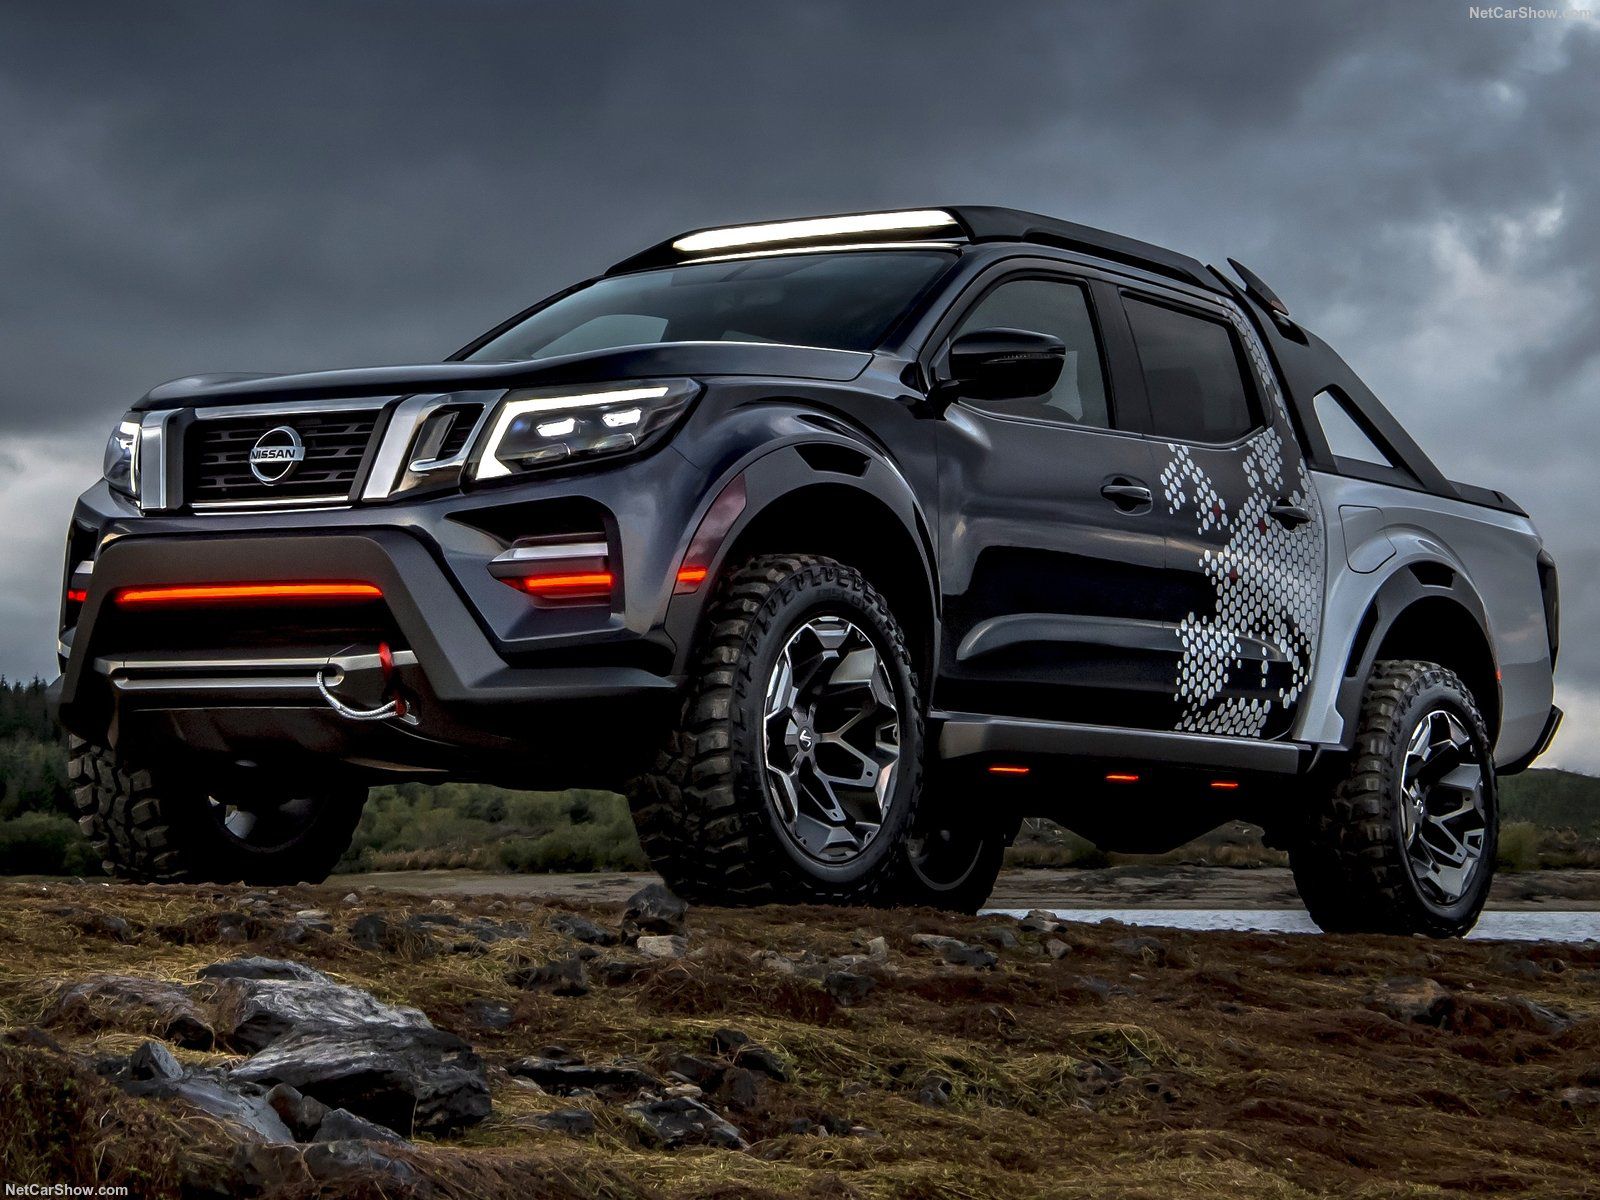
Africa best selling Cars 2017 ranking produced aggregating sales data for 42 markets reports again the domination of the Toyota Hilux, leader in 80% of the African markets. The best car passenger’s is again the Volkswagen Polo, thanks to the outstanding performance in South Africa.
Focus2move is specialized on tracking vehicles sales data in Africa, actually covering 42 markets with detail by segment, brands and models, with figures since the 2010 figures and providing market research by country with forecast up to the 2025. Purpose of this report is provide a snapshot over the best-selling cars in the entire continent in the full year 2017.
The entire continent is dominated since years by a strong pick up, the Toyota Hilux, again leader in the 2017 with 54.454 sales (-10.9%). The first generation Hilux was born in 1968 and in this 50 years was followed by continue update. The current is the eight generation, launched in the 2015 and face-lifted in the 2017. The Hilux has gained a reputation for exceptional sturdiness and reliability during sustained heavy use or even abuse.
In second place and best car passenger there is the Volkswagen Polo with 54.339 units (-11.5%) thanks to the outstanding performance scored in South Africa.
In third place another quite popular other pick up, the Ford Ranger, with 39.032 sales (-2.5%) followed by the Renault Symbol with 37.610 (+32.7%) produced in Algeria and booming in the MAGREB, the Toyota Corolla with 25.138 (-2.5%), the Dacia Logan with 21.152 (-14.0%) and the Renault Clio with 20.895 (+1.5%).
In eight place the Ford Fiesta with 20.583 (-8.1%) ahead of the Dacia Sandero with 17.719 (+26.9%) and in 10th place the Hyundai Tucson with 17.445 (+12.6%).
| Rank 2017 | Rank 2016 | Sales 2017 | Sales 2016 | Variation 2017 | |
|---|---|---|---|---|---|
| 1 | 1 | Toyota Hilux | 56.454 | 63.366 | -10,9% |
| 2 | 2 | Volkswagen Polo | 54.339 | 61.407 | -11,5% |
| 3 | 3 | Ford Ranger | 39.032 | 40.032 | -2,5% |
| 4 | 4 | Renault Symbol | 37.610 | 28.345 | 32,7% |
| 5 | 5 | Toyota Corolla | 25.138 | 25.776 | -2,5% |
| 6 | 6 | Dacia Logan | 21.152 | 24.604 | -14,0% |
| 7 | 8 | Renault Clio | 20.895 | 20.579 | 1,5% |
| 8 | 7 | Ford Fiesta | 20.583 | 22.390 | -8,1% |
| 9 | 16 | Dacia Sandero | 17.719 | 13.965 | 26,9% |
| 10 | 10 | Hyundai Tucson | 17.445 | 15.492 | 12,6% |
| 11 | 14 | Toyota Fortuner | 16.387 | 14.624 | 12,1% |
| 12 | 11 | Toyota Quantum | 15.990 | 15.380 | 4,0% |
| 13 | 21 | Nissan NP200 | 15.625 | 13.039 | 19,8% |
| 14 | 13 | Isuzu KB | 15.434 | 15.186 | 1,6% |
| 15 | 18 | Toyota Etios | 14.927 | 13.198 | 13,1% |
| 16 | 9 | Chevrolet TFR | 14.832 | 17.552 | -15,5% |
| 17 | 31 | Nissan NP300 Hardbody | 13.632 | 9.991 | 36,4% |
| 18 | 15 | Dacia Duster | 13.559 | 14.113 | -3,9% |
| 19 | 29 | Nissan Qashqai | 12.555 | 10.906 | 15,1% |
| 20 | 12 | Kia Picanto | 12.336 | 15.347 | -19,6% |
| 21 | 40 | Volkswagen Golf | 11.322 | 7.987 | 41,8% |
| 22 | 23 | Nissan Sunny | 11.095 | 12.753 | -13,0% |
| 23 | 17 | Ford Ecosport | 11.031 | 13.919 | -20,7% |
| 24 | 24 | Hyundai Elantra | 10.739 | 12.581 | -14,6% |
| 25 | 46 | Dacia Dokker | 10.574 | 7.028 | 50,5% |
| 26 | 42 | Toyota RAV4 | 10.119 | 7.780 | 30,1% |
| 27 | 26 | Hyundai Accent | 9.749 | 11.873 | -17,9% |
| 28 | 19 | Peugeot 208 | 9.562 | 13.178 | -27,4% |
| 29 | 58 | Volkswagen Tiguan | 9.089 | 5.731 | 58,6% |
| 30 | 176 | Renault Kwid | 8.166 | 1.288 | 534,0% |
| 31 | 30 | Hyundai Grand i10 | 8.139 | 10.212 | -20,3% |
| 32 | 22 | Chevrolet Utility | 7.939 | 12.762 | -37,8% |
| 33 | 38 | Renault Duster | 7.802 | 8.279 | -5,8% |
| 34 | 93 | Hyundai Accent sedan | 7.491 | 3.560 | 110,4% |
| 35 | 25 | Hyundai Verna | 7.462 | 12.349 | -39,6% |
| 36 | 35 | Kia Rio | 7.449 | 9.311 | -20,0% |
| 37 | 41 | Ford Focus | 7.154 | 7.819 | -8,5% |
| 38 | 36 | BMW 3 Series | 7.142 | 8.974 | -20,4% |
| 39 | 34 | Mercedes C Class | 7.080 | 9.621 | -26,4% |
| 40 | 27 | Renault Sandero | 7.012 | 11.372 | -38,3% |
| 41 | 50 | Mitsubishi L200 | 6.751 | 6.361 | 6,1% |
| 42 | 28 | Hyundai i20 | 6.714 | 10.918 | -38,5% |
| 43 | 33 | Kia Sportage | 6.667 | 9.688 | -31,2% |
| 44 | 91 | Renault Mégane | 6.522 | 3.601 | 81,1% |
| 45 | 37 | Toyota Yaris | 6.478 | 8.681 | -25,4% |
| 46 | 114 | Renault Kadjar | 6.390 | 2.628 | 143,2% |
| 47 | 126 | Ford Everest | 5.973 | 2.248 | 165,7% |
| 48 | 56 | Toyota Avanza | 5.953 | 5.852 | 1,7% |
| 49 | 47 | Isuzu D-Max | 5.678 | 6.997 | -18,9% |
| 50 | 73 | Nissan Navara | 5.659 | 4.561 | 24,1% |
| 51 | 72 | Renault Kangoo car | 5.616 | 4.668 | 20,3% |
| 52 | 43 | Renault Captur | 5.475 | 7.360 | -25,6% |
| 53 | 65 | Nissan Sentra | 5.428 | 5.090 | 6,6% |
| 54 | 45 | Mitsubishi Lancer EX | 5.365 | 7.189 | -25,4% |
| 55 | 59 | Toyota Land Cruiser P/U | 5.346 | 5.657 | -5,5% |
| 56 | 39 | Peugeot 301 | 5.259 | 8.051 | -34,7% |
| 57 | 55 | Dacia Lodgy | 4.903 | 5.955 | -17,7% |
| 58 | 44 | Toyota Hiace | 4.900 | 7.274 | -32,6% |
| 59 | 90 | Hyundai Creta | 4.879 | 3.603 | 35,4% |
| 60 | 52 | Opel Astra | 4.852 | 6.086 | -20,3% |
| 61 | 87 | Chevrolet Optra | 4.827 | 3.652 | 32,2% |
| 62 | 68 | Mazda CX-5 | 4.709 | 4.936 | -4,6% |
| 63 | 74 | Datsun Go | 4.702 | 4.280 | 9,9% |
| 64 | 76 | Suzuki Swift | 4.630 | 4.222 | 9,7% |
| 65 | 57 | Ford Figo | 4.607 | 5.781 | -20,3% |
| 66 | 53 | Toyota Land Cruiser | 4.562 | 6.016 | -24,2% |
| 67 | 64 | Volkswagen Caddy | 4.534 | 5.109 | -11,3% |
| 68 | 32 | Hyundai i10 | 4.514 | 9.953 | -54,6% |
| 69 | 49 | Peugeot Partner | 4.510 | 6.498 | -30,6% |
| 70 | 66 | Toyota Prado | 4.439 | 5.067 | -12,4% |
| 71 | 54 | Peugeot 308 | 4.299 | 5.962 | -27,9% |
| 72 | 71 | Nissan X-Trail | 4.296 | 4.757 | -9,7% |
| 73 | 48 | Volkswagen Jetta | 4.274 | 6.775 | -36,9% |
| 74 | 60 | Volkswagen Amarok | 4.153 | 5.654 | -26,5% |
| 75 | 69 | Mazda3 | 4.142 | 4.874 | -15,0% |
| 76 | 70 | Kia Cerato | 3.957 | 4.798 | -17,5% |
| 77 | 358 | Volkswagen Scirocco | 3.863 | 164 | 2255,5% |
| 78 | 94 | Nissan Hardbody | 3.810 | 3.492 | 9,1% |
| 79 | 125 | Nissan Almera | 3.797 | 2.252 | 68,6% |
| 80 | 81 | Audi A3 | 3.734 | 4.042 | -7,6% |
| 81 | 103 | Mercedes E Class | 3.700 | 3.002 | 23,3% |
| 82 | 158 | Citroen Berlingo car | 3.661 | 1.573 | 132,7% |
| 83 | 84 | Hyundai H-100 | 3.645 | 3.807 | -4,3% |
| 84 | 67 | Chery Tiggo | 3.636 | 4.987 | -27,1% |
| 85 | 119 | Mazda CX-3 | 3.610 | 2.487 | 45,2% |
| 86 | 82 | Citroen Berlingo | 3.583 | 4.015 | -10,8% |
| 87 | 61 | Suzuki Microbus | 3.509 | 5.481 | -36,0% |
| 88 | 78 | Skoda Octavia | 3.361 | 4.193 | -19,8% |
| 89 | 105 | Mercedes GLA | 3.344 | 2.982 | 12,1% |
| 90 | 147 | Nissan Micra | 3.339 | 1.757 | 90,0% |
| 91 | 63 | Chevrolet Aveo | 3.319 | 5.149 | -35,5% |
| 92 | 97 | Hyundai H-1 | 3.274 | 3.333 | -1,8% |
| 93 | 92 | Seat Leon | 3.234 | 3.578 | -9,6% |
| 94 | 75 | Audi A4 | 3.225 | 4.271 | -24,5% |
| 95 | 115 | Mazda2 | 3.155 | 2.553 | 23,6% |
| 96 | 89 | Citroen C3 | 3.140 | 3.619 | -13,2% |
| 97 | 85 | Ford Kuga | 2.974 | 3.799 | -21,7% |
| 98 | 111 | Mercedes CLA | 2.933 | 2.689 | 9,1% |
| 99 | 127 | Mercedes GLC | 2.904 | 2.216 | 31,0% |
| 100 | 79 | Mazda BT-50 | 2.865 | 4.123 | -30,5% |


