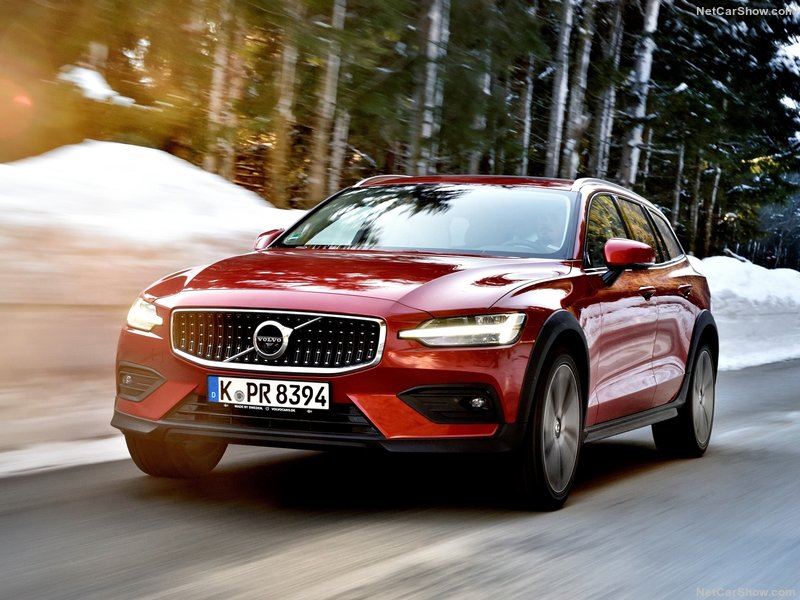
Volvo Global performance in the 2017 has been moderately positive following the remarkable growth shown in the previous 7 years. Fastest growing regions were ASEAN, CIS and Asia. The XC60 is the best selling model.
Following the positive performance reported in the period 2010-2016, during the 2017 Volvo has maintained the pace improving 7.4% with 574.000 global sales.
At regional-wise, the fastest growing areas are the ASEAN (+29.8%), the CIS (+23.5%) and Asia (including China, Korea, Japan and India), up 22.8% while sales fell down in North Africa and Pacific.
The best selling model was the XC60 with 181.459 sales, followed by the V40 with 95.983 and the XC90 with 79.402.
Global Automotive Database
Based on the over 750 millions vehicles sales downloaded within of GAD (Global Auto Database) collected and aggregated by hundreds selected sources covering over 140 vehicles markets worldwide, our “Brand Performance Reports” refer to registrations data.
Volvo Global Performance Report
In the period 2010-2017 Volvo global sales improved from 364.000 in the 2010 to 574.000 in the 2017, performing a Compound annual growth rate (C.A.G.R) of +7.8%, while the industry CAGR in the period was +4.6%.
In this period, Volvo gained two steps within the Global Car Brands Ranking landing in the 41st place.
Sales split at regional level confirmed the supremacy of the European region counting the 56.6% of total sales (it was 66.3% in the 2010). However, sales in Asia are improving share actually counting 23.1% (from 11.7%), while American sales declining at 18.4% of the total (from 19.6%).
In our report we figure out this brand’s sales data in 95 different countries, with forecast up to the 2022.
On top of all, in the 2016 there was China with 16.9% of global sales share (from 6.2% in the 2010), ahead of USA with 15.4% (from 14.8%), Sweden with 13.3% (from 14.7%), United Kingdom with 8.7% and Germany with 7.5%.
Please click on the product figure to see the Contents details.
| Rank 2017 | Rank 2016 | Sales 2016 | Sales 2017 | Variation 2017 | Mix 2017 | Sales 2018 e | |
|---|---|---|---|---|---|---|---|
| 8 | 8 | Asean | 2.997 | 3.891 | 29,8% | 0,7% | 3.826 |
| 5 | 5 | CIS | 6.556 | 8.097 | 23,5% | 1,4% | 8.317 |
| 2 | 2 | Asia | 118.044 | 144.992 | 22,8% | 25,3% | 161.193 |
| 11 | 11 | GCC | 979 | 1.160 | 18,5% | 0,2% | 1.584 |
| 4 | 4 | LatAm | 9.128 | 10.279 | 12,6% | 1,8% | 11.768 |
| 7 | 7 | Europe East | 4.379 | 4.803 | 9,7% | 0,8% | 5.439 |
| 10 | 10 | Levant | 1.403 | 1.489 | 6,1% | 0,3% | 1.636 |
| 1 | 1 | UE | 292.791 | 302.338 | 3,3% | 52,7% | 318.487 |
| 3 | 3 | America North | 88.696 | 88.609 | -0,1% | 15,4% | 96.789 |
| 9 | 9 | Africa | 2.336 | 2.226 | -4,7% | 0,4% | 2.262 |
| 6 | 6 | Pacific | 6.486 | 5.478 | -15,5% | 1,0% | 5.293 |
| 12 | 12 | Africa North | 952 | 757 | -20,5% | 0,1% | 862 |
| Total | 534.747 | 574.118 | 7,4% | 100,0% | 617.455 |
| Rank 2017 | Rank 2016 | Sales 2017 | Sales 2016 | Variation 2017 | |
|---|---|---|---|---|---|
| 1 | 1 | Volvo XC60 | 181.459 | 160.724 | 12,9% |
| 2 | 2 | Volvo V40 | 95.983 | 98.115 | -2,2% |
| 3 | 3 | Volvo XC90 | 79.402 | 78.381 | 1,3% |
| 4 | 4 | Volvo S60 | 55.401 | 57.107 | -3,0% |
| 5 | 10 | Volvo S90 | 44.509 | 5.918 | 652,1% |
| 6 | 5 | Volvo V60 | 32.649 | 36.923 | -11,6% |
| 7 | 13 | Volvo S/V90 | 27.773 | 3.646 | 661,7% |
| 8 | 7 | Volvo S/V60 | 19.218 | 22.729 | -15,4% |
| 9 | 17 | Volvo V90 | 17.196 | 2.246 | 665,6% |
| 10 | 9 | Volvo XC90 PHEV | 7.608 | 9.465 | -19,6% |


