Bosnia new cars market kept the recovering during the entire 2017 ending with 10.803 sales, up 21.8%. The industry is fueled by positive economic trend. Volkswagen fights with Skoda for the leadership, but the star of the year is Ford, up 283%.
Bosnia economy seemed to regain its foothold in Q3 following a bleak Q2 performance, when activity was dampened in part due to unfavorable weather conditions. Industrial production surged in year-on-year terms in the July-to-September period on the back of healthy manufacturing output, particularly in the production of electronic goods. However, the IMF warned in late November that Bosnia had weeks to carry out key economic reforms, including raising taxes on fuel and drafting a law on deposit insurance, to unfreeze pending disbursements.
Bosnian vehicles market in recent years has recovered following the deep fall scored in the 2008-2009 crisis. In the last five years annual sales volume grew up from 8.421in the 2012 to 8.870 in the 2016, recovering the 2013 fall. In the 2017, light vehicles sales have been 10.803, up 21.8%.
| Sales 2012 | Sales 2013 | Sales 2014 | Sales 2015 | Sales 2016 | Sales 2017 | Sales 2018 e | |
|---|---|---|---|---|---|---|---|
| Car | 8.421 | 6.368 | 6.514 | 6.044 | 7.798 | 9.582 | 10.032 |
| LCV | - | - | - | 798 | 1.072 | 1.221 | 1.221 |
| Total | 8.421 | 6.368 | 6.514 | 6.842 | 8.870 | 10.803 | 11.253 |
| 2012 Var | 2013 Var | 2014 Var | 2015 Var | 2016 Var | 2017 Var | 2018 var e | |
|---|---|---|---|---|---|---|---|
| Car | -3,8% | -24,4% | 2,3% | -7,2% | 29,0% | 22,9% | 4,7% |
| LCV | 34,3% | 13,9% | 0,0% | ||||
| Total | -3,8% | -24,4% | 2,3% | 5,0% | 29,6% | 21,8% | 4,2% |
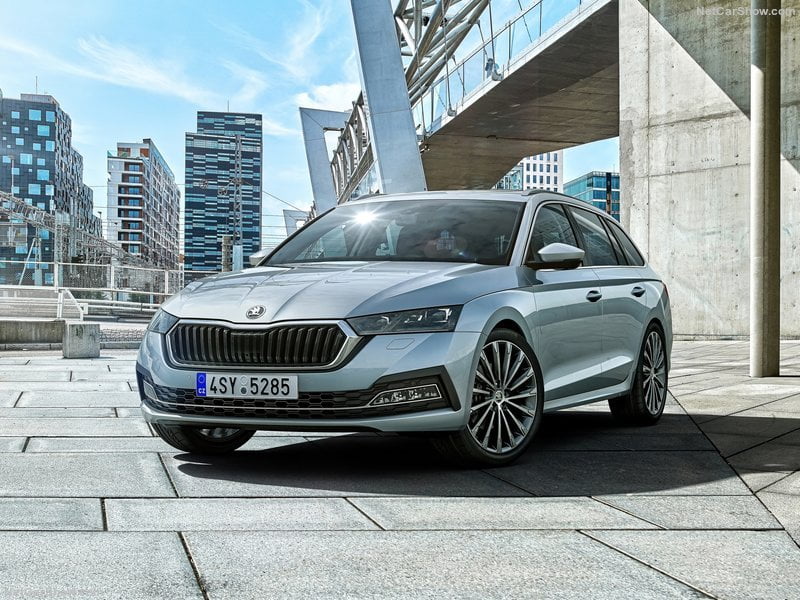
Brand-wise (just car passenger’s), the market leader was again Skoda with 1.530 units (+5.9%) fighting with the second, Volkswagen arrived at 1.451 sales (+6.8%). Combined the two hold a share of 31.1%.
In third place Opel with 843 (+5.8%). The fastest brand this year is Ford, up 283%, 6th with 598 sales.
The best-selling model was again the Skoda Octavia with 477 units (-21.7%) followed by the Volkswagen Golf with 457 (-14.6%), and the Opel Astra with 402 sales (+5%).
| Rank 2017 | Rank 2016 | Brand | Sales 2017 | Sales 2016 | Variation 2017 | Share 2017 | Share 2016 |
|---|---|---|---|---|---|---|---|
| 1 | 1 | Skoda | 1.530 | 1.445 | 5,9% | 16,0% | 18,5% |
| 2 | 2 | Volkswagen | 1.451 | 1.358 | 6,8% | 15,1% | 17,4% |
| 3 | 3 | Opel | 843 | 797 | 5,8% | 8,8% | 10,2% |
| 4 | 4 | Renault | 616 | 475 | 29,7% | 6,4% | 6,1% |
| 5 | 5 | Dacia | 610 | 430 | 41,9% | 6,4% | 5,5% |
| 6 | 13 | Ford | 598 | 156 | 283,3% | 6,2% | 2,0% |
| 7 | 7 | Toyota | 597 | 406 | 47,0% | 6,2% | 5,2% |
| 8 | 6 | Hyundai | 483 | 413 | 16,9% | 5,0% | 5,3% |
| 9 | 8 | Peugeot | 422 | 311 | 35,7% | 4,4% | 4,0% |
| 10 | 9 | Audi | 375 | 281 | 33,5% | 3,9% | 3,6% |
| Rank 2017 | Rank 2016 | Sales 2017 | Sales 2016 | Variation 2017 | |
|---|---|---|---|---|---|
| 1 | 1 | Skoda Octavia | 477 | 604 | -21,0% |
| 2 | 2 | Volkswagen Golf | 457 | 535 | -14,6% |
| 3 | 4 | Opel Astra | 402 | 383 | 5,0% |
| 4 | 21 | Ford Focus | 394 | 115 | 242,6% |
| 5 | 7 | Skoda Fabia | 377 | 263 | 43,3% |
| 6 | 5 | Volkswagen Passat | 299 | 333 | -10,2% |
| 7 | 3 | Renault Clio | 291 | 413 | -29,5% |
| 8 | 10 | Dacia Duster | 257 | 190 | 35,3% |
| 9 | 21 | Ford Fiesta | 232 | 115 | 101,7% |
| 10 | 13 | Hyundai Tucson | 231 | 183 | 26,2% |


