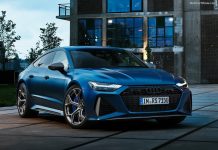
Singapore Vehicles Market in 2015 boomed at best since 2008 thanks to lower CEE price. The car passenger’s sold were near double than in the previous year albeit the market has the highest car price worldwide.
Economic Outlook
Singapore’s economy rebounded notably in the third quarter, expanding 1.9% over the previous quarter at a seasonally adjusted annualized rate (SAAR) (Q2: -2.6% SAAR). The figure was revised sharply up from the 0.1% increase reported in the advance reading and came on the back of a significant expansion in services and smaller drag from manufacturing. Singapore has been relying on its strong finance sector to shelter the economy from the spillover effects from China’s slowdown.
Data for the fourth quarter suggest that growth is tepid: non-oil domestic exports swung to contraction and manufacturing plunged in October.
Market Outlook
Albeit huge cost of certification and the highest vehicle price in the World, the Singapore new cars market is the fastest growing worldwide in the 2015.
In the limited space of this state-metropolis, the key element actually influencing the new vehicles sales is the price of CEE – the Certificates of Entitlements (the right to register a new car) – which had been considerably reduced last year after having peaked up level higher than the base cost of the single car.
The effect on sales had been strong with the market that is booming since months and with the full year 2015 hitting the best performance out of last seven years.
According to data released by the Singapore Bureau of Statistics, total vehicles sold in the 2015 had been 78.392, up 65.9% from the previous year. Within this figure the car passenger’s sales were 57.388 (excluding Taxis), up 98.4%, while commercial vehicles were 17.049 (+19.0%) and Taxis were flat at 4.060.
Please note that from now onwards, we will report Singapore data as Total vehicles (including cars, commercial vehicles and taxi) while in the table just the car passengers performance will be featured.
Below, you can sort our interactive tables to see data regarding Brands, Groups and Models. Please bear in mind that sales data are subject to adjustments as sources will update their information. This report is updated at the publishing date and will not be modified while the next on this subject will always have the year to date data updated.
| Rank Dec | Rank 2015 | Brand | Sales Dec | Sales 2015 | Dec Var | 2015 Var | Share Dec | Share 2015 |
|---|---|---|---|---|---|---|---|---|
| 1 | 1 | Toyota | 1.120 | 10.151 | 280,7% | 187,6% | 17,6% | 17,6% |
| 2 | 2 | Honda | 1.044 | 7.916 | 261,2% | 413,7% | 16,4% | 13,8% |
| 3 | 3 | Nissan | 803 | 5.574 | 234,6% | 204,8% | 12,6% | 9,7% |
| 7 | 4 | Mercedes | 329 | 5.408 | 1,9% | 16,3% | 5,2% | 9,4% |
| 4 | 5 | Mazda | 613 | 5.287 | 122,9% | 168,8% | 9,6% | 9,2% |
| 5 | 6 | BMW | 453 | 3.608 | 81,9% | 11,4% | 7,1% | 6,3% |
| 9 | 7 | Volkswagen | 211 | 3.056 | -3,7% | 21,2% | 3,3% | 5,3% |
| 8 | 8 | Audi | 264 | 2.093 | 35,4% | 33,7% | 4,2% | 3,6% |
| 6 | 9 | Lexus | 347 | 2.021 | 119,0% | 6,3% | 5,5% | 3,5% |
| 12 | 10 | Hyundai | 152 | 1.805 | 97,4% | 107,7% | 2,4% | 3,1% |
| 10 | 11 | Subaru | 200 | 1.668 | 88,7% | 166,0% | 3,1% | 2,9% |
| 11 | 12 | Kia | 178 | 1.586 | 93,5% | 111,7% | 2,8% | 2,8% |
| 13 | 13 | Mitsubishi | 100 | 1.379 | 376,2% | 1645,6% | 1,6% | 2,4% |
| 14 | 14 | Volvo | 94 | 1.274 | -13,0% | 40,0% | 1,5% | 2,2% |
| 15 | 15 | Citroen | 66 | 685 | 83,3% | 151,8% | 1,0% | 1,2% |
| 25 | 16 | Porsche | 9 | 553 | -76,9% | 47,5% | 0,1% | 1,0% |
| 17 | 17 | Peugeot | 54 | 525 | 116,0% | 129,3% | 0,8% | 0,9% |
| 19 | 18 | Jaguar | 45 | 385 | 36,4% | 12,9% | 0,7% | 0,7% |
| 21 | 19 | Chevrolet | 32 | 361 | -3,0% | 23,2% | 0,5% | 0,6% |
| 20 | 20 | Land Rover | 36 | 349 | -2,7% | 16,7% | 0,6% | 0,6% |
| 24 | 21 | Ford | 16 | 323 | 100,0% | 55,3% | 0,3% | 0,6% |
| 16 | 22 | Renault | 60 | 316 | 62,2% | 152,8% | 0,9% | 0,5% |
| 22 | 23 | Mini | 30 | 297 | 42,9% | 53,9% | 0,5% | 0,5% |
| 18 | 24 | Suzuki | 50 | 257 | 194,1% | 140,2% | 0,8% | 0,4% |
| 23 | 25 | Infiniti | 21 | 222 | 5,0% | 144,0% | 0,3% | 0,4% |
| 26 | 26 | Maserati | 6 | 75 | 100,0% | 33,9% | 0,1% | 0,1% |
| 26 | 27 | SsangYong | 6 | 73 | #DIV/0! | 461,5% | 0,1% | 0,1% |
| 29 | 28 | Bentley | 2 | 66 | -66,7% | -5,7% | 0,0% | 0,1% |
| 27 | 29 | Opel | 5 | 63 | 400,0% | -38,2% | 0,1% | 0,1% |
| 29 | 30 | Ferrari | 2 | 41 | #DIV/0! | 32,3% | 0,0% | 0,1% |
| 28 | 31 | Alfa Romeo | 4 | 31 | 100,0% | -11,4% | 0,1% | 0,1% |
| 31 | 32 | Jeep | - | 29 | -100,0% | 70,6% | 0,0% | 0,1% |
| 31 | 33 | Lamborghini | - | 20 | -100,0% | 100,0% | 0,0% | 0,0% |
| 31 | 33 | Rolls-Royce | - | 20 | #DIV/0! | 5,3% | 0,0% | 0,0% |
| 30 | 34 | Alpina | 1 | 9 | 0,0% | 12,5% | 0,0% | 0,0% |
| 31 | 35 | Aston Martin | - | 5 | -100,0% | 25,0% | 0,0% | 0,0% |
| 29 | 35 | Chery | 2 | 5 | #DIV/0! | 150,0% | 0,0% | 0,0% |
| 31 | 35 | Chrysler | - | 5 | #DIV/0! | -50,0% | 0,0% | 0,0% |
| 31 | 36 | McLaren | - | 4 | -100,0% | -63,6% | 0,0% | 0,0% |
| 31 | 37 | Fiat | - | 3 | -100,0% | -50,0% | 0,0% | 0,0% |
| 31 | 37 | Mitsuoka | - | 3 | -100,0% | 50,0% | 0,0% | 0,0% |
| 31 | 37 | Daihatsu | - | 3 | #DIV/0! | -50,0% | 0,0% | 0,0% |
| 31 | 38 | Ruf | - | 1 | -100,0% | -50,0% | 0,0% | 0,0% |
| 31 | 38 | Austin | - | 1 | #DIV/0! | #DIV/0! | 0,0% | 0,0% |
| 31 | 38 | Triumph | - | 1 | -100,0% | -50,0% | 0,0% | 0,0% |
| 31 | 38 | MG | - | 1 | -100,0% | -50,0% | 0,0% | 0,0% |
| 31 | 38 | Morris | - | 1 | #DIV/0! | #DIV/0! | 0,0% | 0,0% |
| Rank Dec | Rank 2015 | Group | Sales Dec | Sales 2015 | Dec Var | 2015 Var | Share Dec | Share 2015 |
|---|---|---|---|---|---|---|---|---|
| 1 | 1 | Toyota | 1.467 | 12.175 | 224,1% | 123,9% | 23,1% | 21,2% |
| 2 | 2 | Honda | 1.044 | 7.916 | 261,2% | 413,7% | 16,4% | 13,8% |
| 3 | 3 | Renault-Nissan | 884 | 6.112 | 197,6% | 198,9% | 13,9% | 10,6% |
| 4 | 6 | Mazda | 613 | 5.287 | 122,9% | 168,8% | 9,6% | 9,2% |
| 5 | 4 | Volkswagen | 486 | 5.788 | 5,7% | 27,4% | 7,6% | 10,1% |
| 6 | 7 | BMW | 484 | 3.934 | 78,6% | 13,7% | 7,6% | 6,8% |
| 7 | 8 | Hyundai-Kia | 330 | 3.391 | 95,3% | 109,6% | 5,2% | 5,9% |
| 8 | 5 | Mercedes Daimler | 329 | 5.408 | 1,9% | 16,3% | 5,2% | 9,4% |
| 9 | 9 | Fuji Heavy Industries | 200 | 1.668 | 88,7% | 166,0% | 3,1% | 2,9% |
| 10 | 12 | PSA | 120 | 1.210 | 96,7% | 141,5% | 1,9% | 2,1% |
Wishing to know all about this market, consider to purchase the just released research:


